Blog Section
Exploring the Fear and Greed Index: Its Potential in Predicting Securities Returns
"Be fearful when others are greedy and greedy only when others are fearful." - Warren Buffett
This famous quote raises an intriguing question: Can investor sentiment help predict investment opportunities and, by extension, provide predictability in securities returns? In theory, this concept aligns with the expectation that returns should be higher during "bad" times and lower during "good" times.
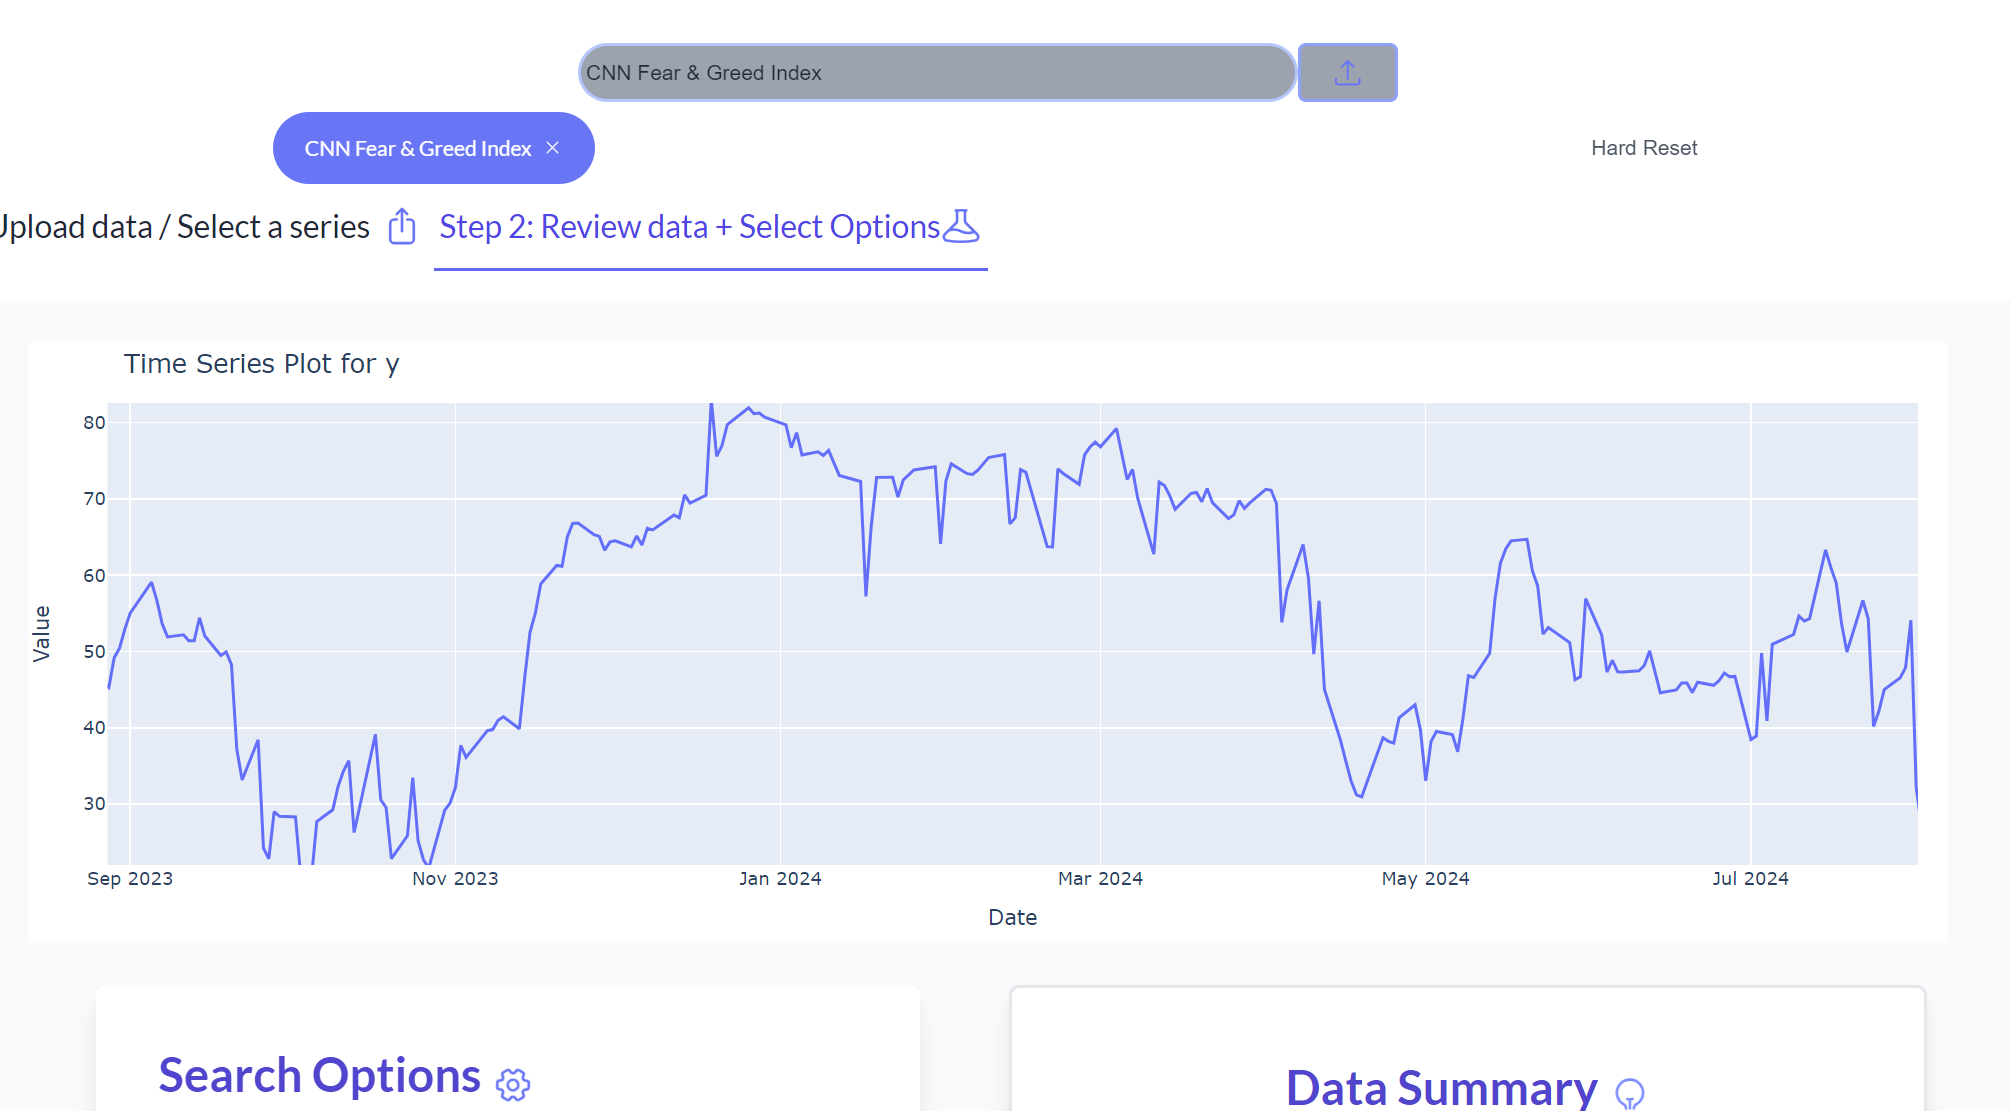
This article explores the hypothesis that the Fear & Greed Index (F&G), as an exogenous variable (x), could potentially improve the forecast of returns (r) for certain assets, particularly market indices with less idiosyncratic risk. The analysis utilizes the CNN Fear and Greed Index as a proxy variable, given its widespread media coverage.
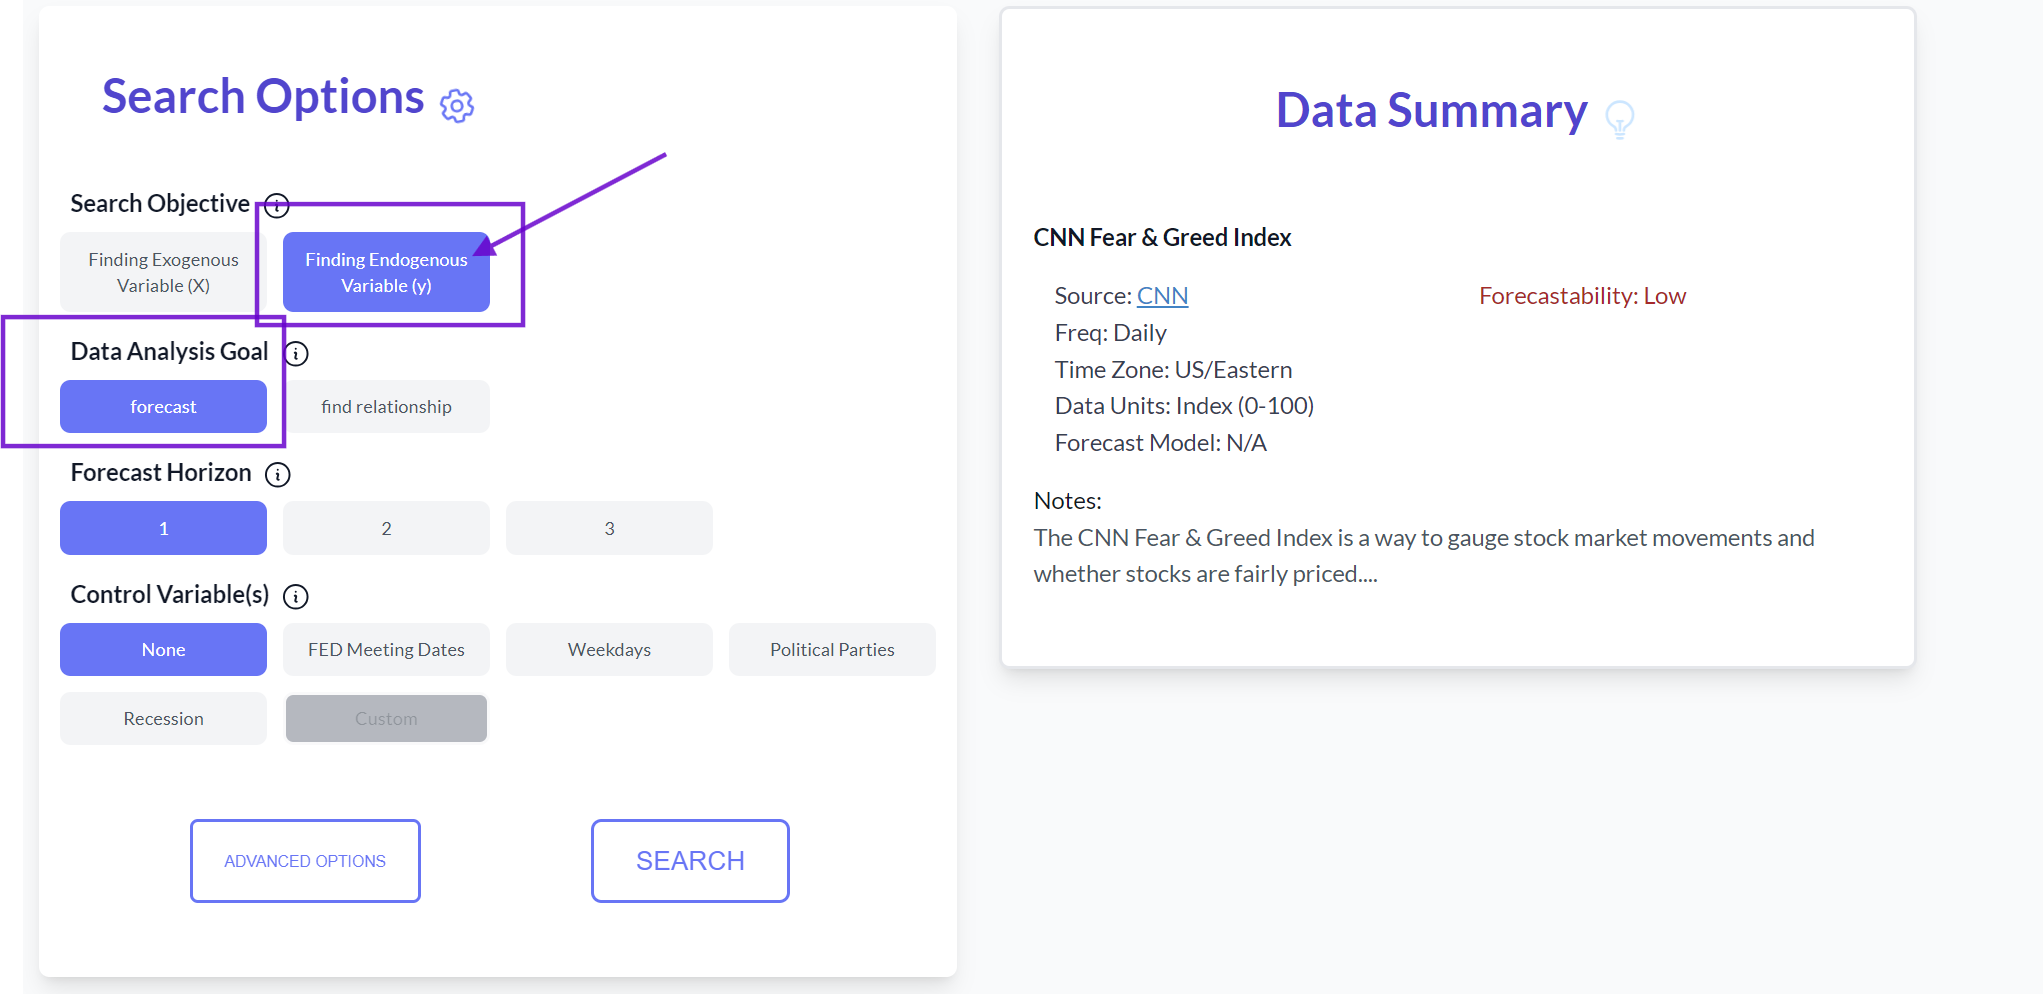
 Our search engine includes a "Find Endogenous Variable (y)" function that aligns with this concept. It uses the Fear and Greed Index (F&G) as x and attempts to identify any series in the selective database that it might be able to predict. If successful, it displays the improvement and ranks the results.
Given our focus on forecasting, the forecast option was selected with a 1-step forecast horizon.
Our search engine includes a "Find Endogenous Variable (y)" function that aligns with this concept. It uses the Fear and Greed Index (F&G) as x and attempts to identify any series in the selective database that it might be able to predict. If successful, it displays the improvement and ranks the results.
Given our focus on forecasting, the forecast option was selected with a 1-step forecast horizon.
 Interestingly, three particular series stood out in the search results: ^AXJO and ^N225 daily returns from Yahoo Finance, and the "Daily Sterling Overnight Index Average (SONIA) Rate" from FRED. These results were saved for further analysis, as they align with the hypothesis that the F&G index could potentially predict market index returns.
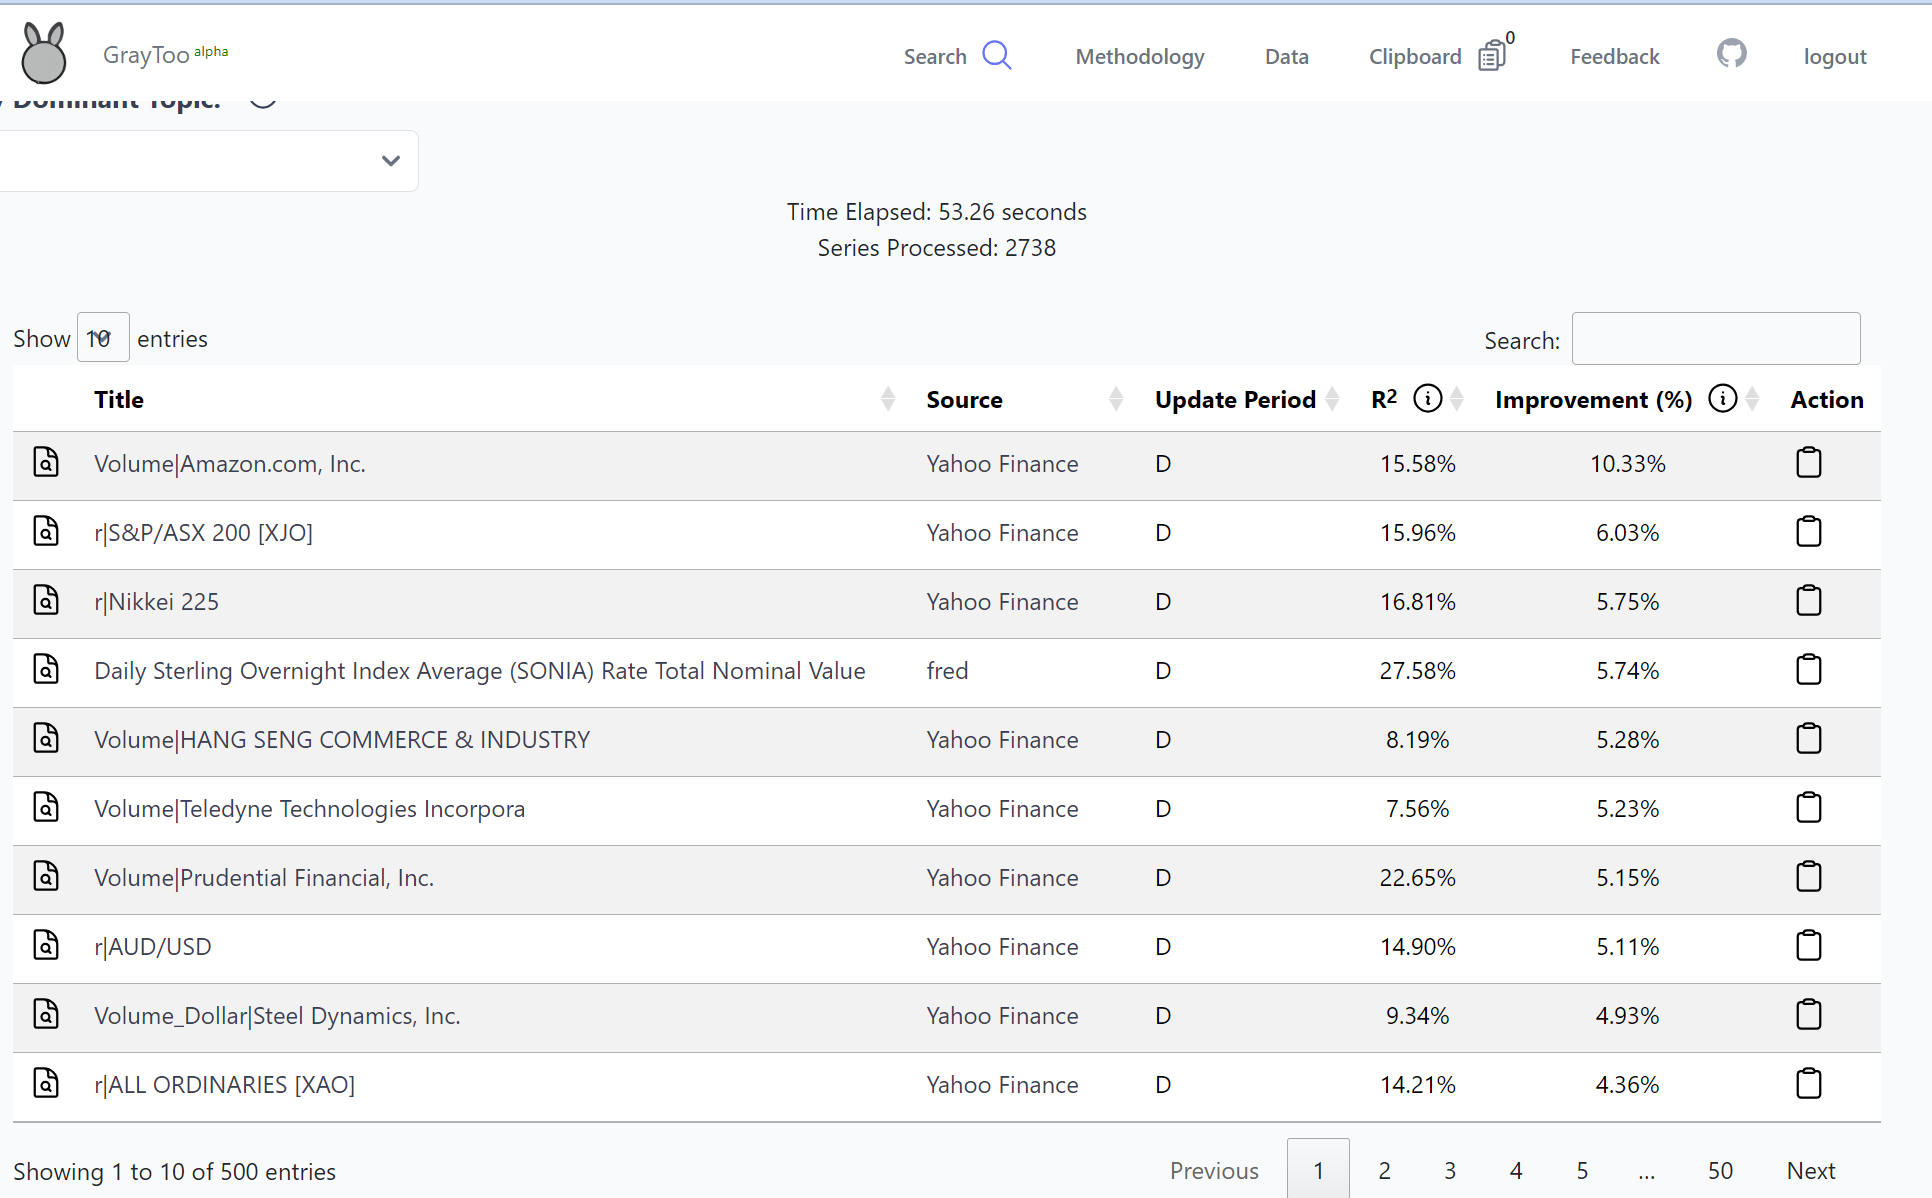 These series were selected due to their stationary nature, requiring minimal preprocessing for immediate analysis.
Further analysis of the data yielded the following results:
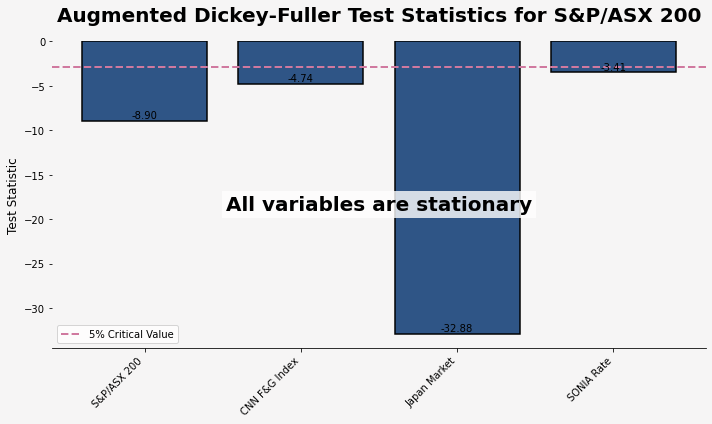
Stationarity Test: All series (Fear and Greed index from CNN, 2 YF series, and 1 FRED series) passed the Augmented Dickey-Fuller tests, confirming their stationarity.
These series were selected due to their stationary nature, requiring minimal preprocessing for immediate analysis.
Further analysis of the data yielded the following results:
Stationarity Test: All series (Fear and Greed index from CNN, 2 YF series, and 1 FRED series) passed the Augmented Dickey-Fuller tests, confirming their stationarity.
 Granger Causality Test: To validate the search engine's results, a Granger Causality Test was conducted. The results were positive, indicating that for Lag = 2, the F&G index is statistically significant in predicting the returns of ^AXJO and ^N225. The high r2 results warrant further investigation, as they could be due to potential data leakage issues arising from time differences between exchanges.
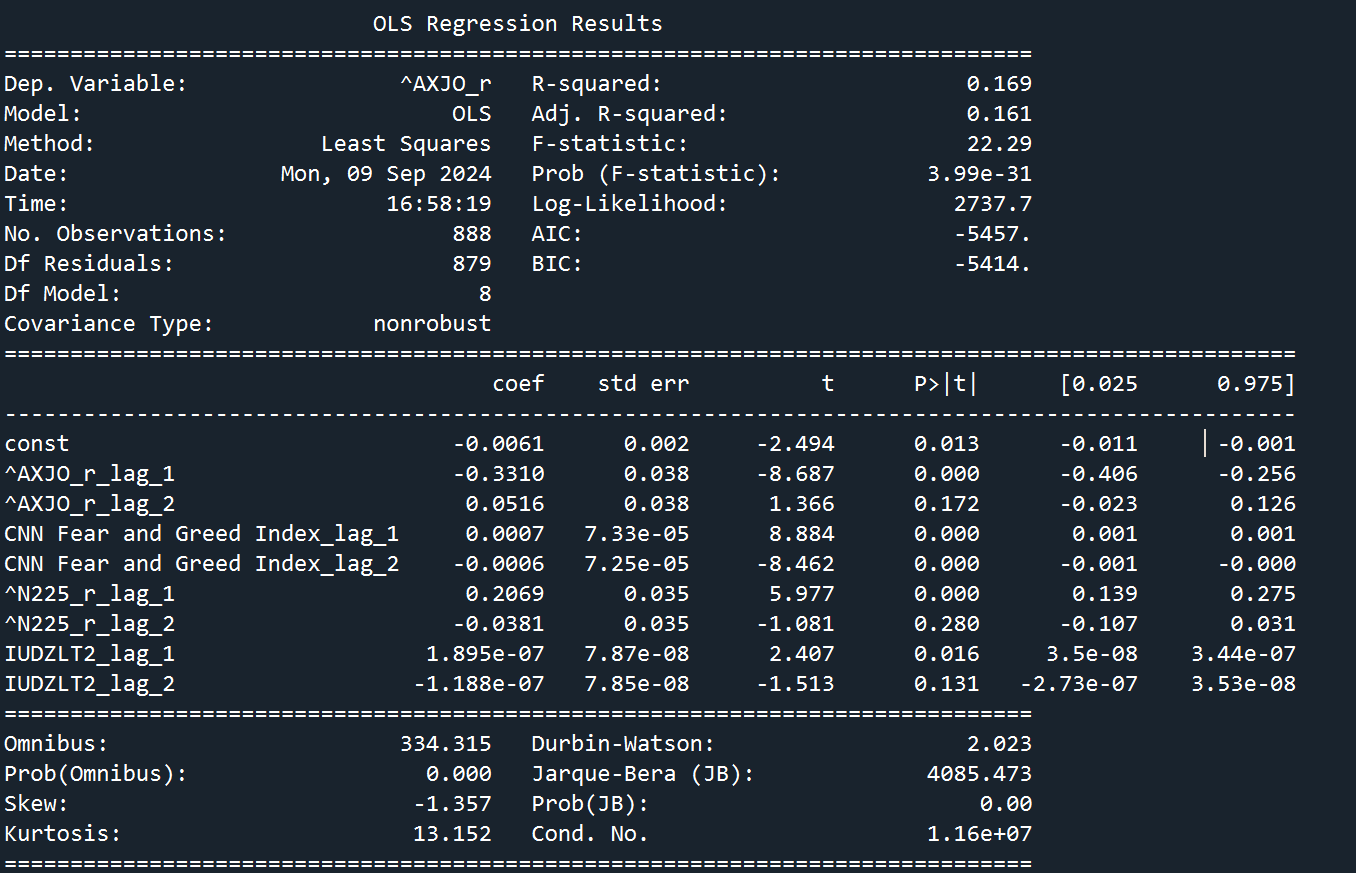
Linear Regression Model: To assess the strength of the predictive effect, a standard Linear Regression Model was tested. The model's summary showed an out-of-sample R2 of 16%, which is notably high for explaining returns.
Granger Causality Test: To validate the search engine's results, a Granger Causality Test was conducted. The results were positive, indicating that for Lag = 2, the F&G index is statistically significant in predicting the returns of ^AXJO and ^N225. The high r2 results warrant further investigation, as they could be due to potential data leakage issues arising from time differences between exchanges.
Linear Regression Model: To assess the strength of the predictive effect, a standard Linear Regression Model was tested. The model's summary showed an out-of-sample R2 of 16%, which is notably high for explaining returns.
 Correlation Analysis: A correlation plot was examined to understand the high predictability.
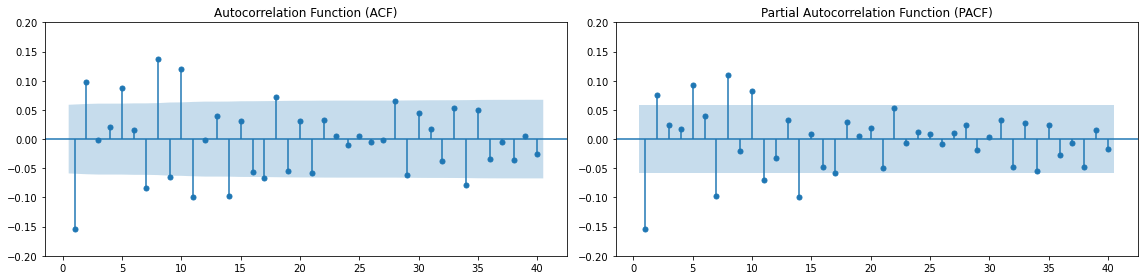
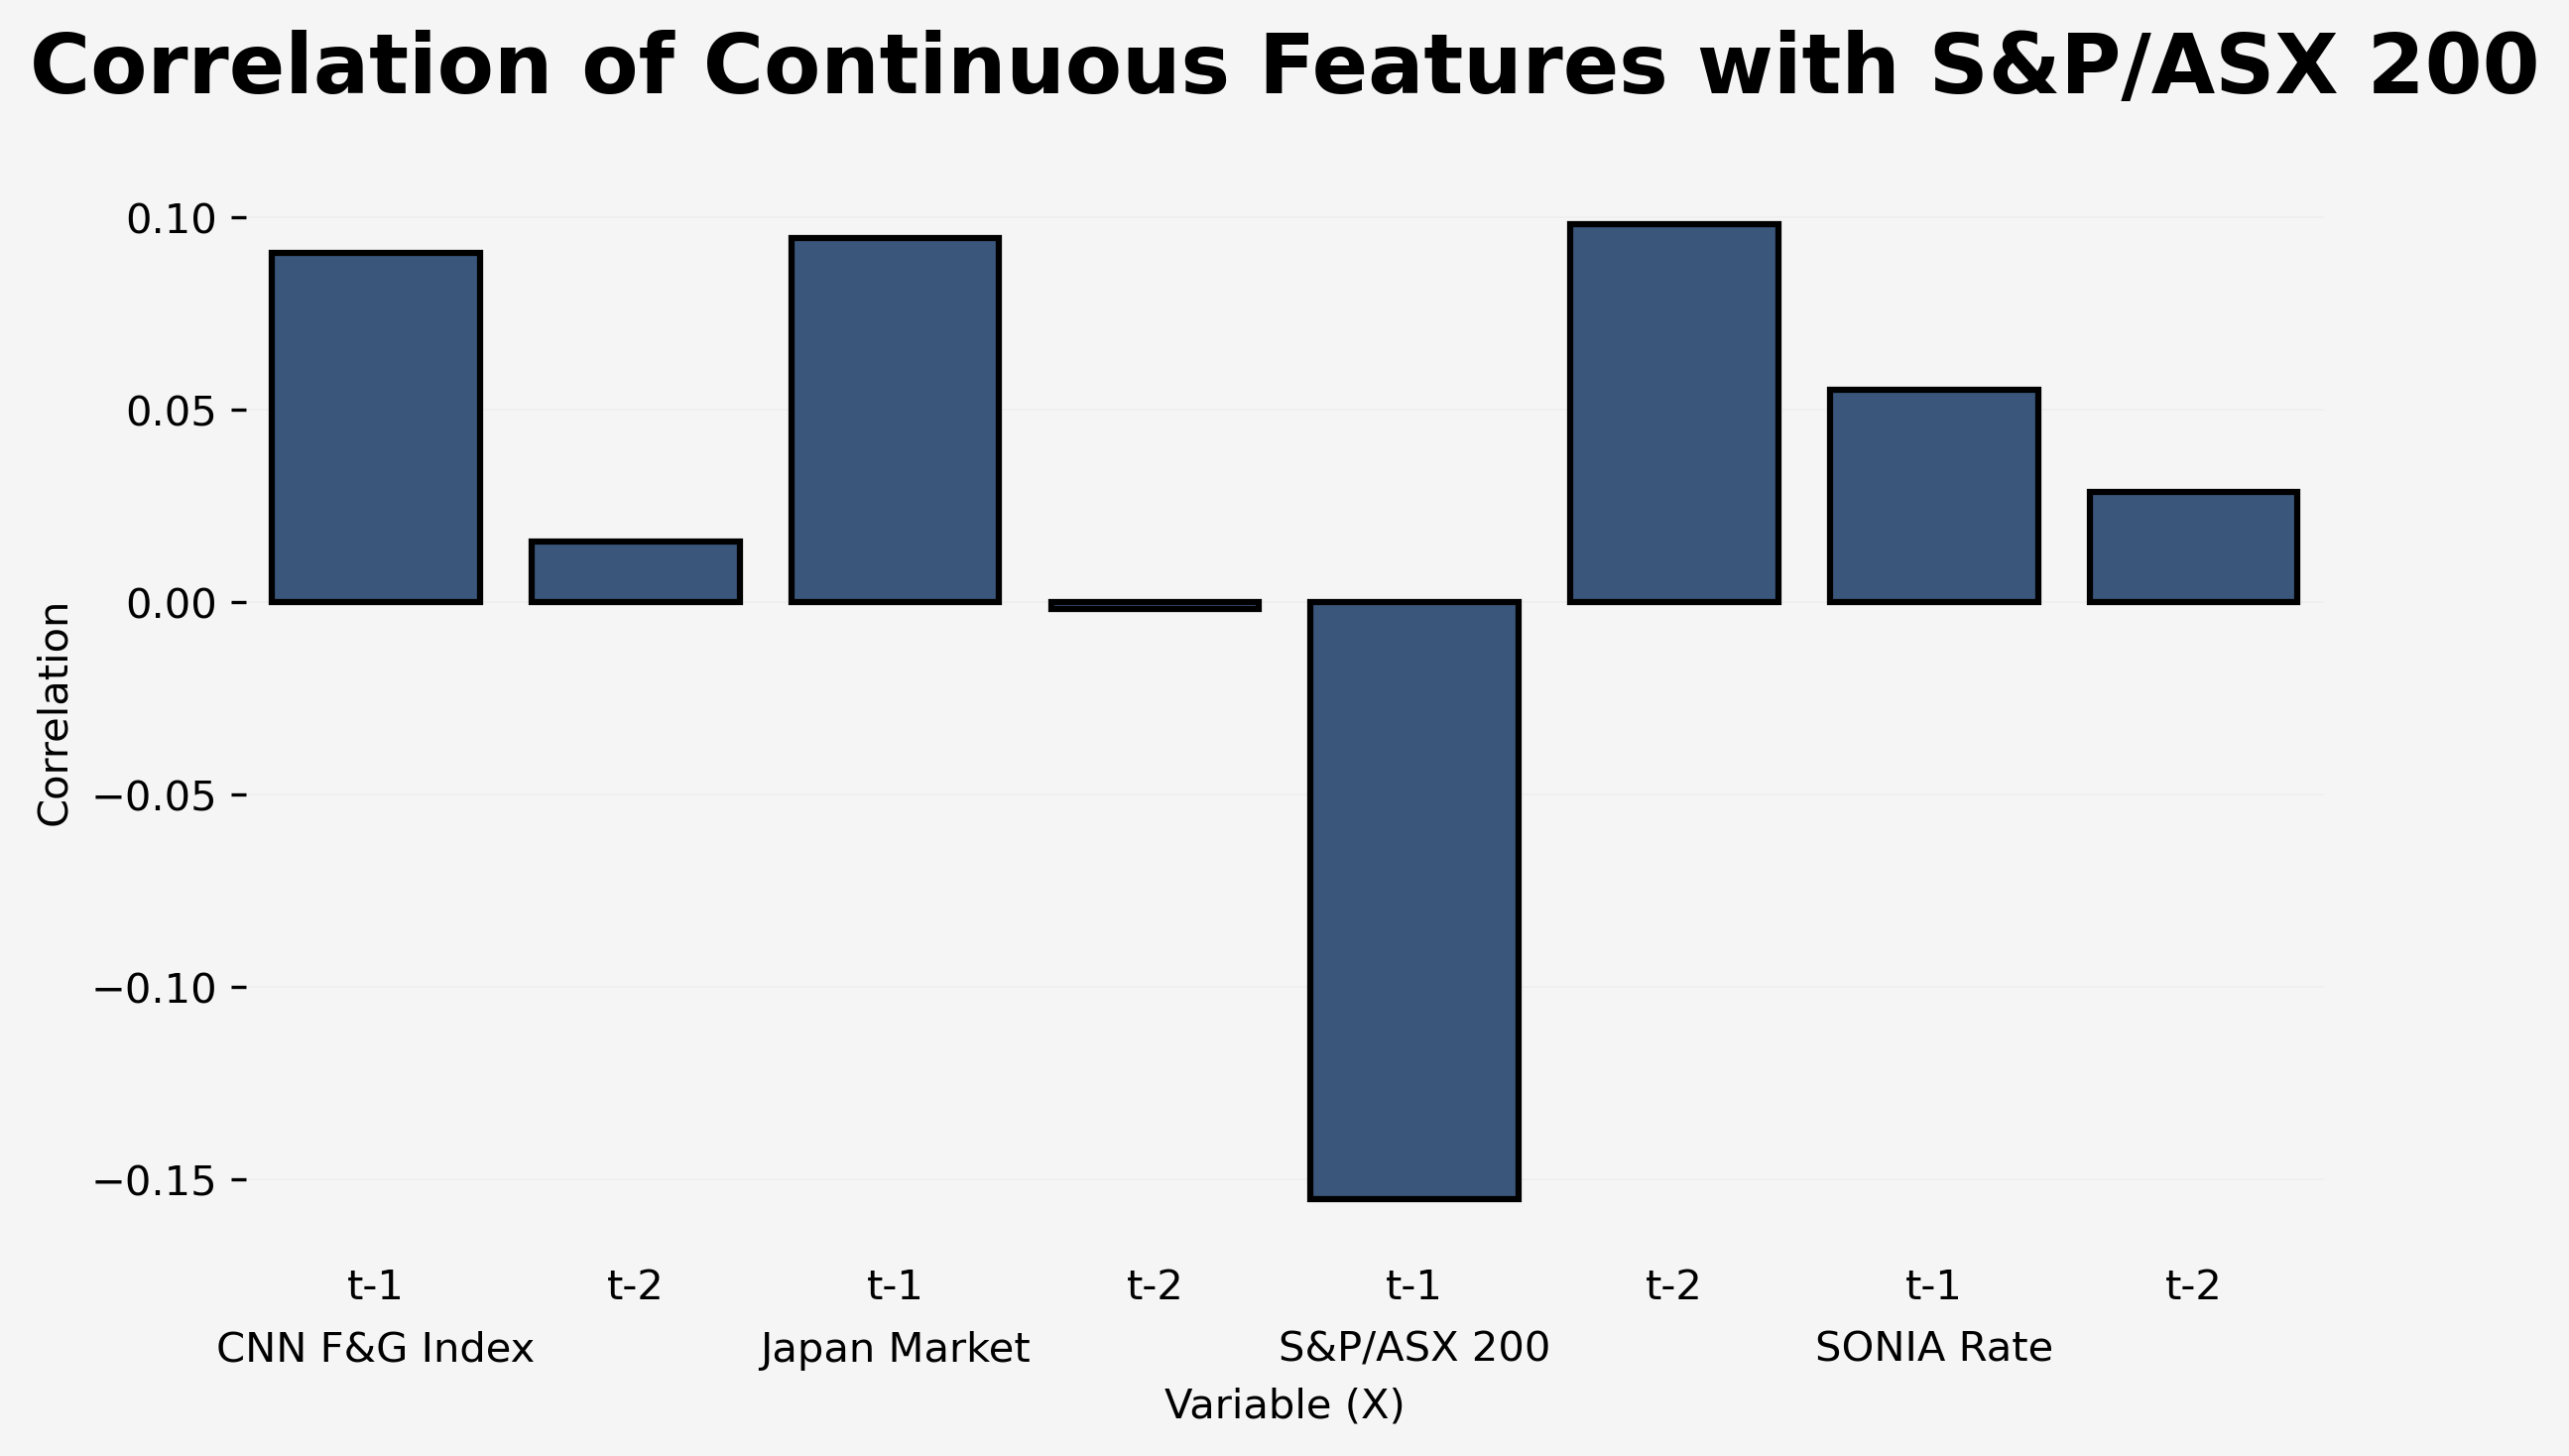 The Fear and Greed Index showed a 0.1 correlation with the target variable (^AXJO daily return). Interestingly, AXJO_(t-1) exhibited a correlation of -0.15 at lag 1. An auto-correlation plot confirmed that the auto-correlation of lag 1 and lag 2 of the target variable exceeded the confidence bound, suggesting this was unlikely to occur by chance.
 This observation partially explains the high R2. A feature importance analysis provided additional insights:
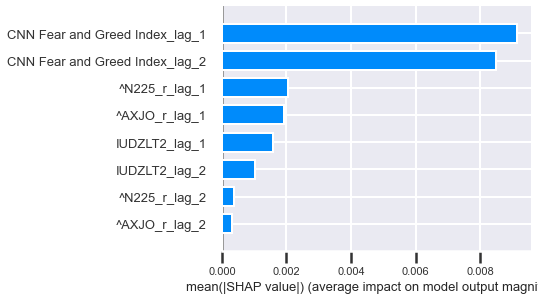 The F&G index demonstrated higher importance compared to the lagged return of the index. However, the R2 (16%) is roughly equivalent to the correlation for lag 1 (15%). This suggests that a significant portion of the predictability may stem from the auto-correlation of the target variable, with the model considering the F&G index a slightly better feature compared to its lag.
The presence of auto-correlation in the daily return of the index is noteworthy, as it deviates from the expectation of white noise. A brief literature review reveals this to be a widely studied phenomenon in market indices.
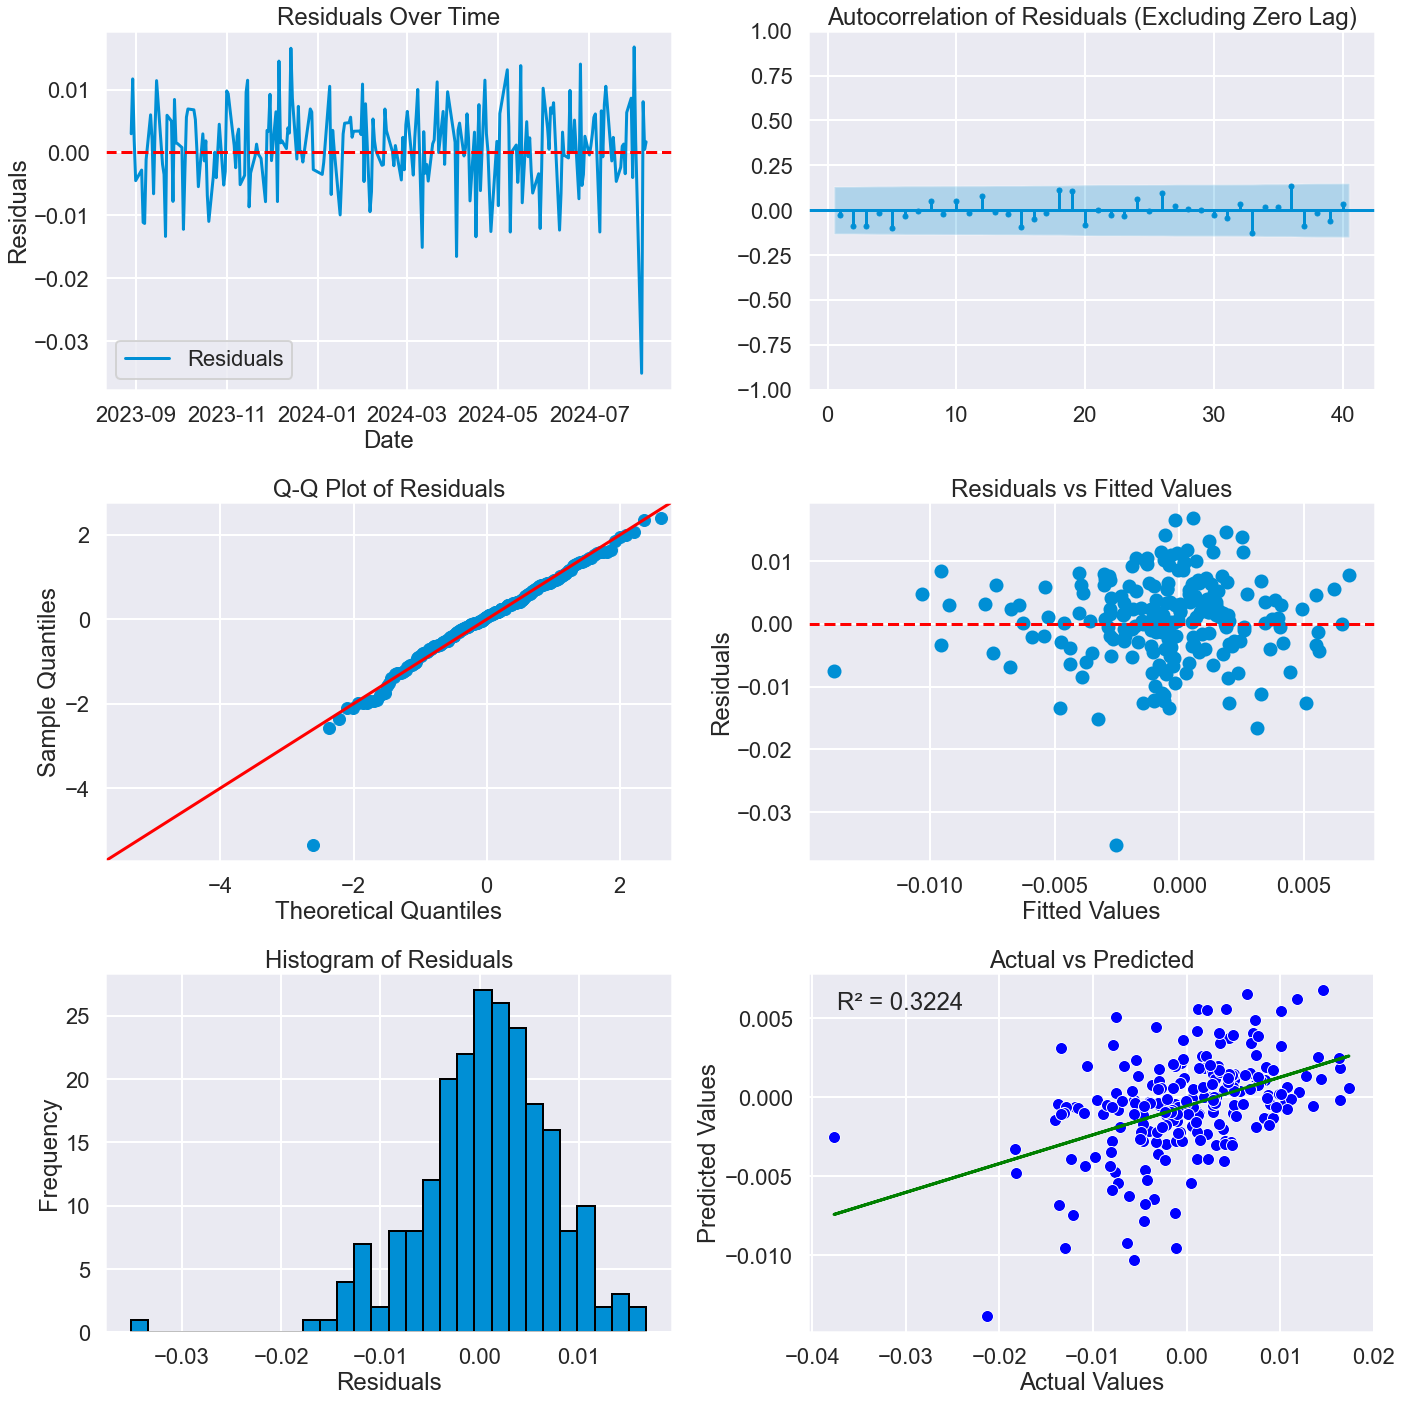
Residual plot analysis showed no discernible patterns, and the model passed all relevant tests, indicating its validity.
The F&G index demonstrated higher importance compared to the lagged return of the index. However, the R2 (16%) is roughly equivalent to the correlation for lag 1 (15%). This suggests that a significant portion of the predictability may stem from the auto-correlation of the target variable, with the model considering the F&G index a slightly better feature compared to its lag.
The presence of auto-correlation in the daily return of the index is noteworthy, as it deviates from the expectation of white noise. A brief literature review reveals this to be a widely studied phenomenon in market indices.
Residual plot analysis showed no discernible patterns, and the model passed all relevant tests, indicating its validity.
 Further analysis could involve testing the model's sensitivity using more time period cross-validation folds, exploring other models such as ensembles, or conducting feature engineering. However, the most crucial next step is to verify whether these results stem from data leakage by thoroughly examining both the definition of the series and their collection methods.
In conclusion, this example demonstrates how the search engine can be utilized to explore potential data linkages and conduct further testing and analysis on publicly available data. While the results are intriguing, they underscore the importance of rigorous validation and careful interpretation in financial data analysis.
Further analysis could involve testing the model's sensitivity using more time period cross-validation folds, exploring other models such as ensembles, or conducting feature engineering. However, the most crucial next step is to verify whether these results stem from data leakage by thoroughly examining both the definition of the series and their collection methods.
In conclusion, this example demonstrates how the search engine can be utilized to explore potential data linkages and conduct further testing and analysis on publicly available data. While the results are intriguing, they underscore the importance of rigorous validation and careful interpretation in financial data analysis.