Blog Section
Forecasting US Monthly Unemployment Rate
Introduction
This blog post demonstrates how Graytoo can be leveraged to discover useful features, potentially improving forecast accuracy.
In this example, Graytoo rediscovered the features widely used in the literature related to unemployment forecasting, reducing the benchmark root mean square error by ~50%.
Data
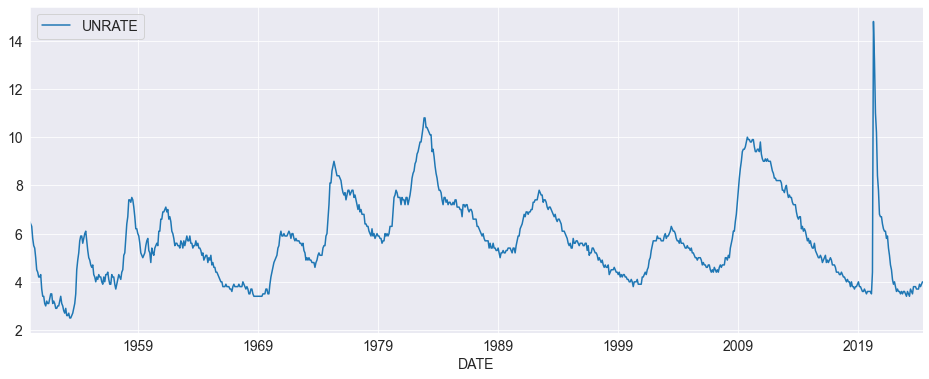
We use the US monthly unemployment rate (UNRATE) from FRED. The training period starts from 1950, with the test period spanning from 2000-01-01 to 2024-05-01 (~300 observations).
Methodology
Our approach focuses on using Graytoo to discover potentially useful features. We'll compare models using out-of-sample Root Mean Square Error (RMSE) and the Diebold-Mariano (DM) test for statistical significance. This blog focuses on how to use the search engine to enhance forecasts so details of the whole analysis is in another post.
Feature Discovery Process
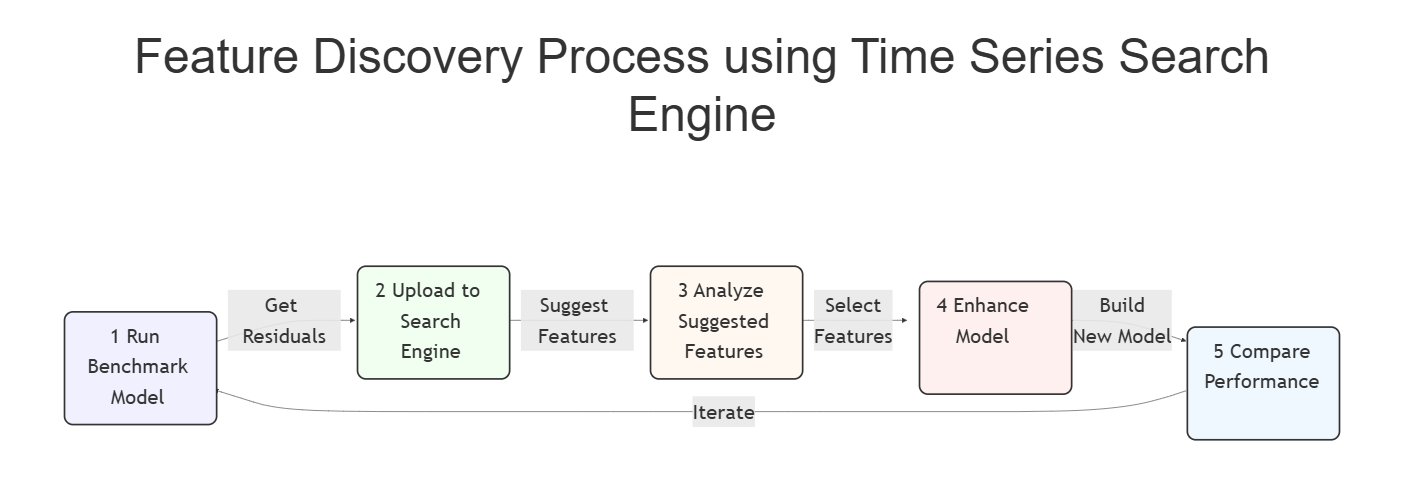
1) Get Benchmark Model
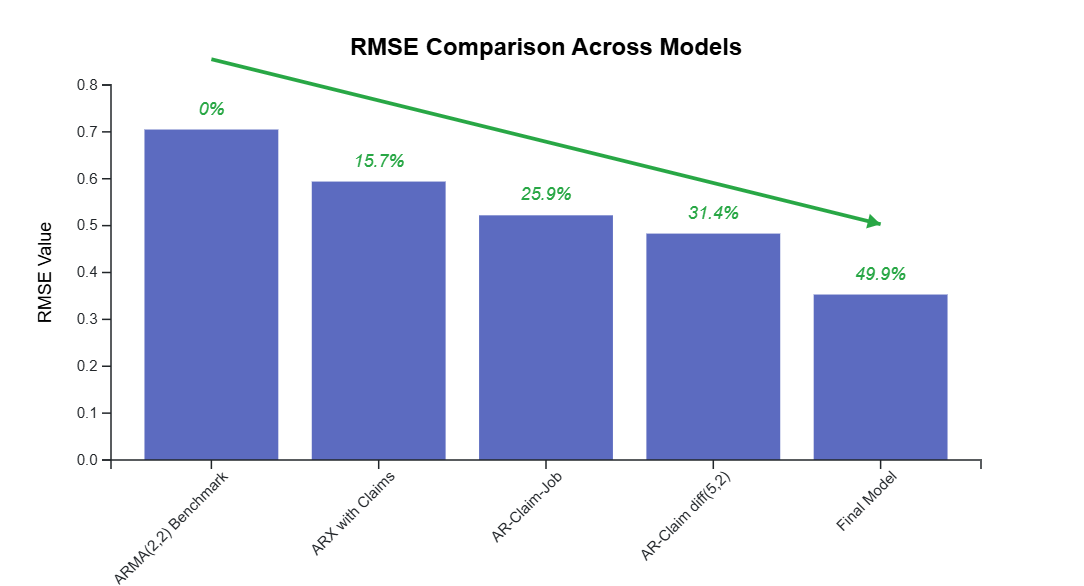
We start with a basic ARMA(2,2) model as our benchmark, selected using the Bayesian Information Criterion (BIC), and this gives a RMSE of .705 as the benchmark score.
2) Upload residuals to Search Engine
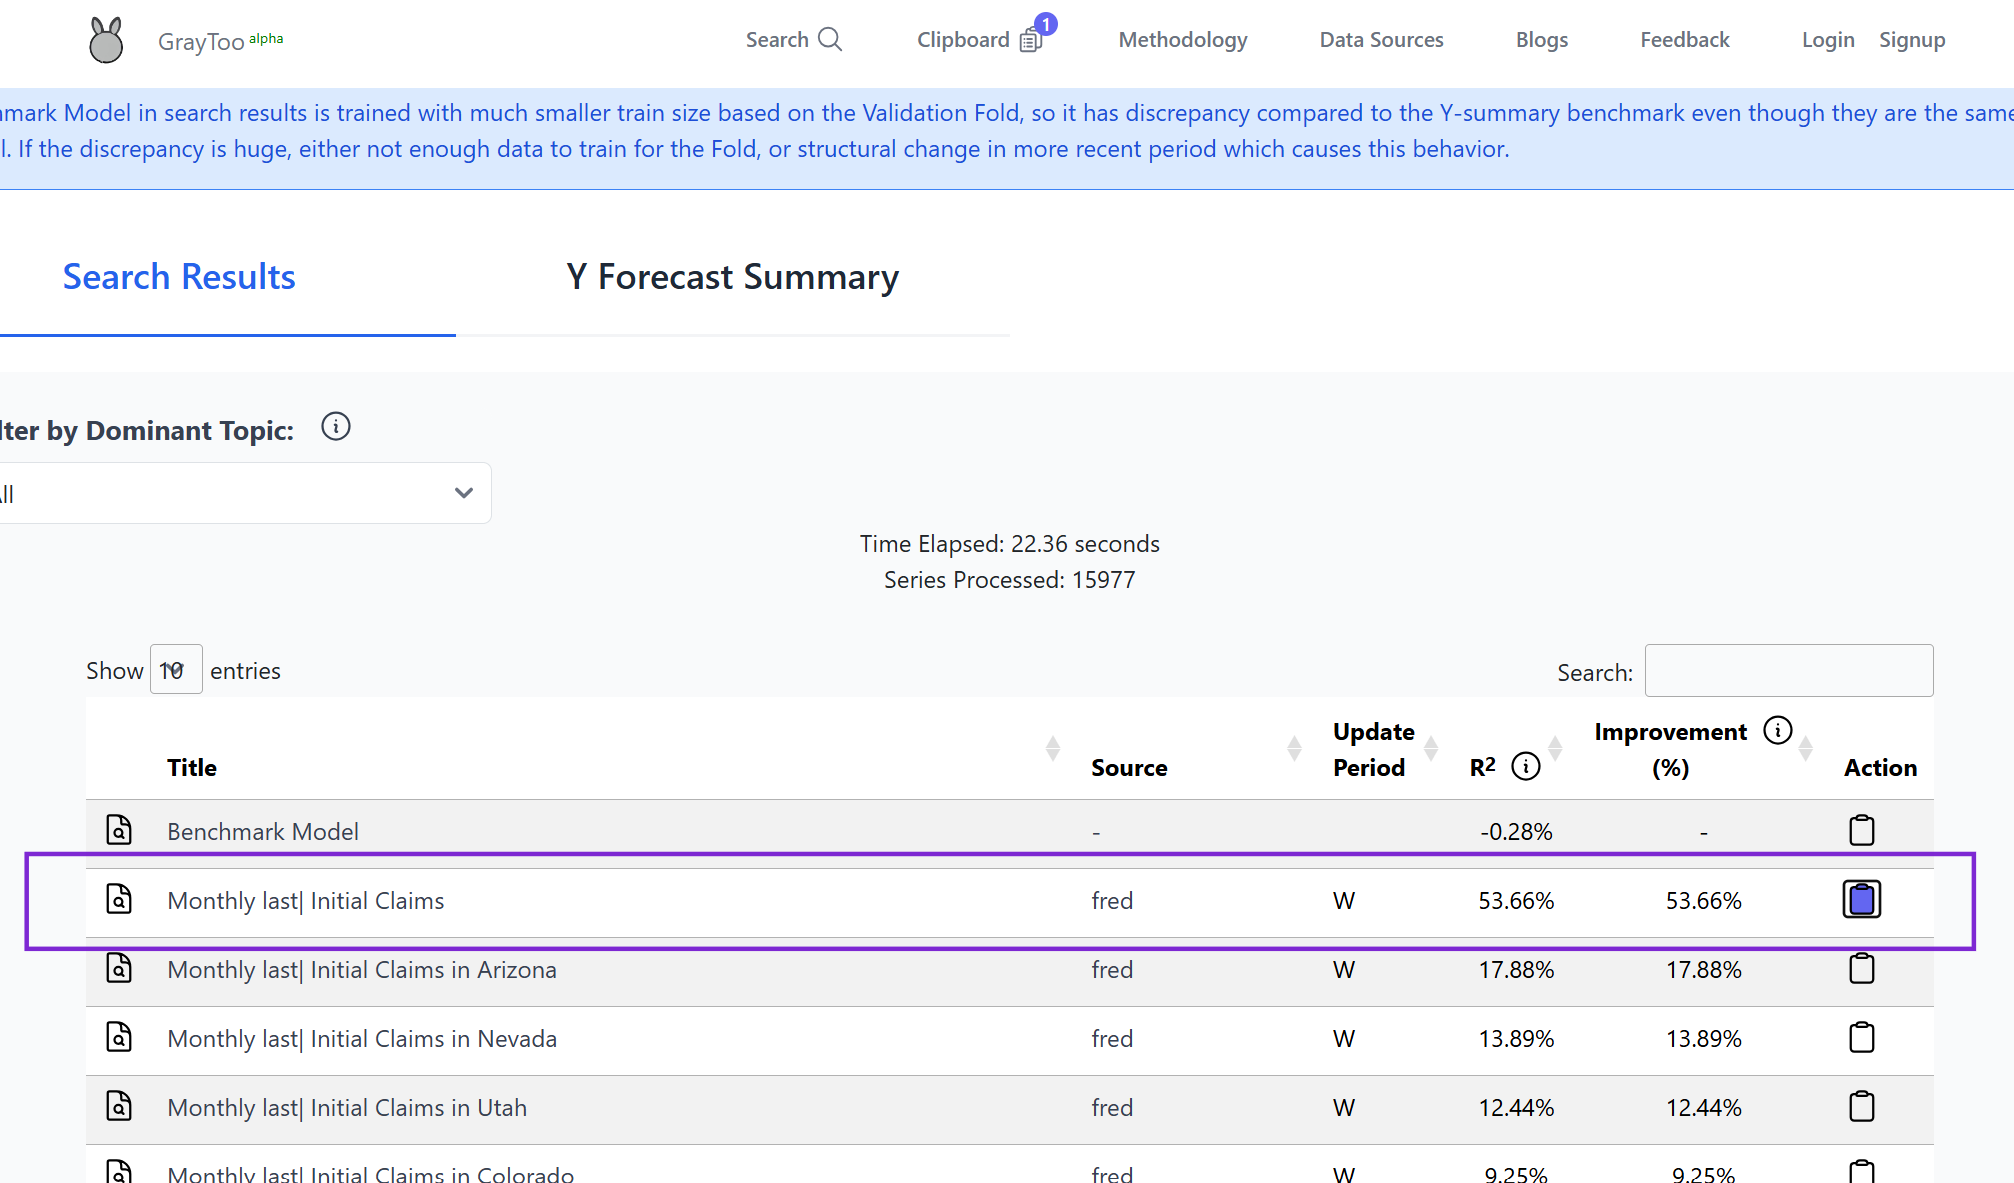
The search engine identified weekly initial unemployment claims (ICSA) as a potentially useful feature. This aligns with economic intuition, as initial claims are a leading indicator of unemployment (Montgomery et al., 1998).
Model RMSE: 0.594 (15.7% improvement)
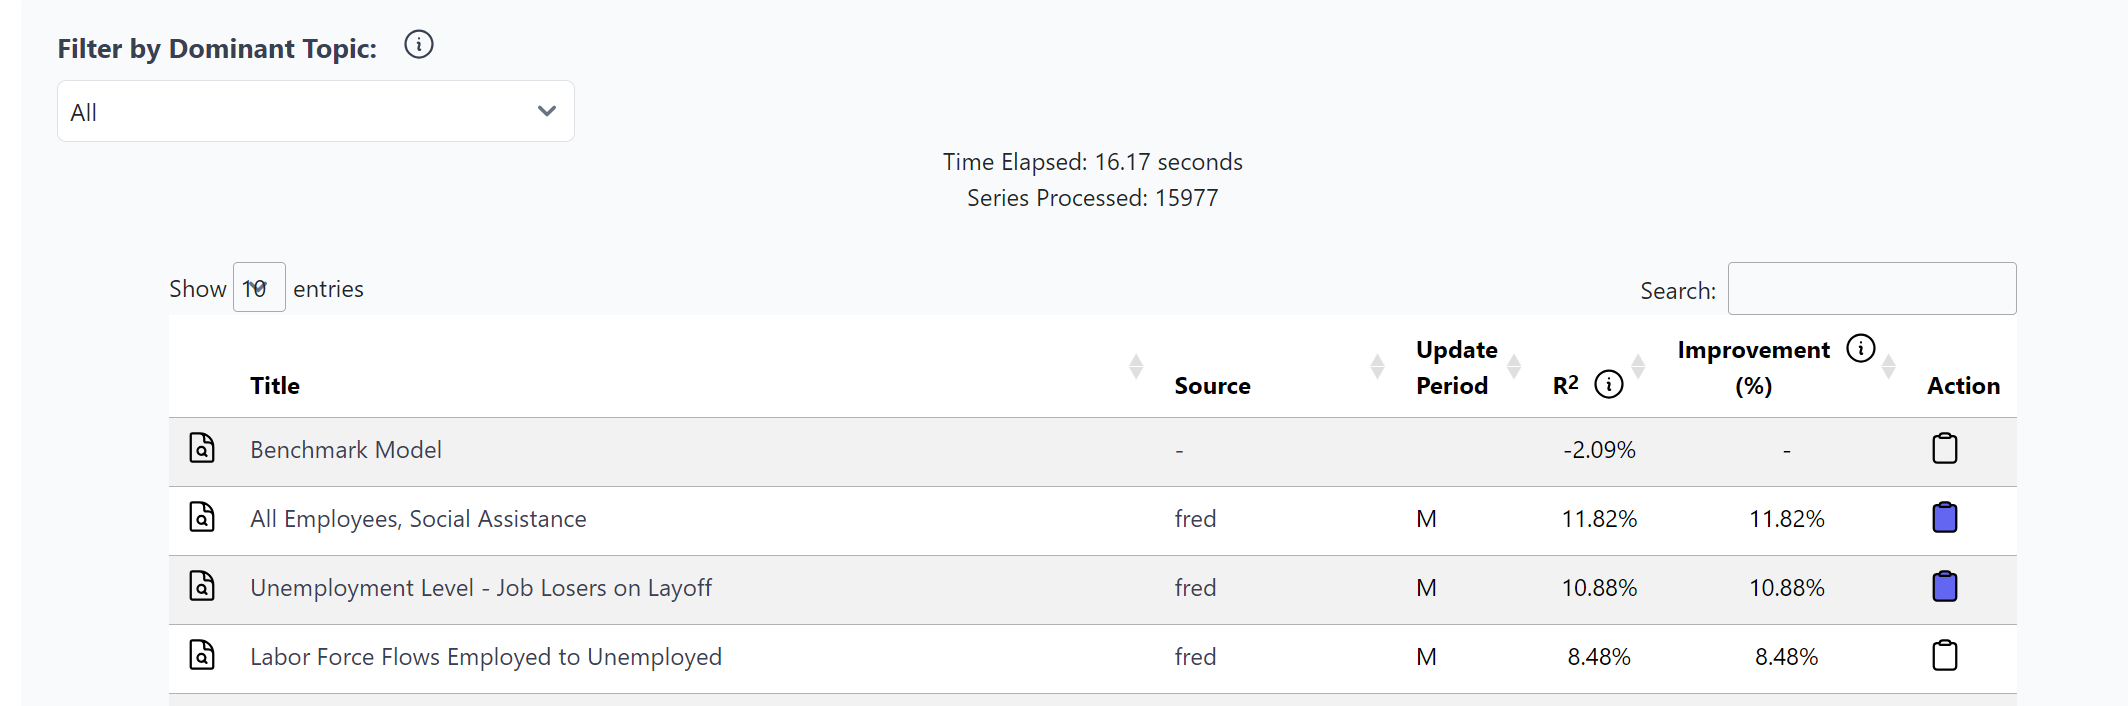
4) Repeat Process
Repeating the procedures of uploading the residuals on Graytoo, we discovered additional features to use in the model, which are:
- Unemployment Level - Job Losers on Layoff (Monthly)
- Labor Force Flows Employed to Unemployed (Monthly)
- All Employees, Social Assistance (Monthly)
Further Exploration
Incorporating these led to mixed results, AR(5), claim(2), Job(1) model is constructed using only the Job Losers on Layoff series in addition to the previously identified features from BIC.
Model RMSE: 0.522 (25.9% improvement over benchmark)
The true AR order of the monthly unemployment should be lower, suggested by this extra variable Job Loser, as well as the univariate ARMA model (2, 0, 2) if considered monthly unemployment is highly persistent I(0) variable or (1, 1, 2) if I(1).
Either using residual of ARIMA to fit the claim variable, or simply use AR-Claim diff(5, 2) model yields better results,
Model RMSE: 0.483 (31.4% improvement over benchmark)
Final Model
Inspecting the current features, I notice that utilizing weekly claims that are at weekly frequency yields better results. Carefully checking the release time, occasionally, the latest available weekly claim reference week actually partly falls in the next unemployment release, so by including that weekly claim lag, sometimes we are able to have a peek for the next unemployment release.
This lowers RMSE to .353. (49.9% improvement over benchmark)
Statistical Validation
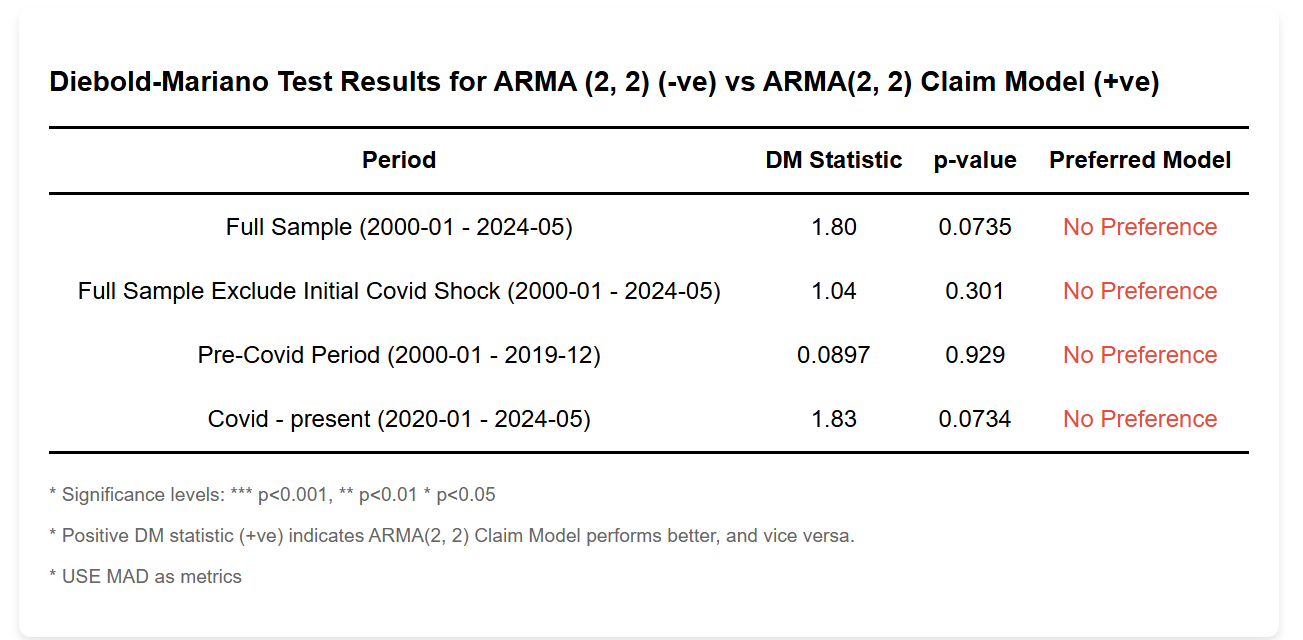
From the Diebold-Mariano test, we could not reject the Null hypothesis that the weekly claim model does better. Since DM-test has lower power with overlapping and nested model, this seems reasonable. Notice that DM statistics drops significantly if we exclude the covid shock, this means large performance gain is from 'nowcasting' the shock better using the weekly claim data.
Discussion
The time series search engine proved valuable in identifying relevant features for unemployment rate forecasting. The inclusion of weekly initial claims data significantly improved forecast accuracy, especially during periods of rapid change like the COVID-19 pandemic.
While not all suggested features improved the model, the search engine efficiently guided our feature selection process, saving time and potentially uncovering non-obvious relationships.
Concluding Remark
This case study illustrates the potential of using a time series search engine as a complementary tool for feature discovery in forecasting tasks. By systematically exploring a wide range of time series data, we were able to identify potentially useful features that improved our unemployment rate forecasts. While traditional approaches remain valuable, this method offers an additional avenue for discovering relevant variables that might not be immediately obvious.
References
Barnichon, Regis, Christopher, Nekarda, 2012. The ins and outs of forecasting unemployment: using labor force flows to forecast the labor market. Brookings Papers on Economic Activity
Diebold, F. X. and Mariano, R. S. (1995), Comparing predictive accuracy, Journal of business & economic statistics 13(3), 253-264.
Montgomery, A. L., Zarnowitz, V., Tsay, R. S., & Tiao, G. C. (1998). Forecasting the U.S. unemployment rate. Journal of the American Statistical Association, 93(442), 478-493.