Blog Section
What drives US Inflation?
Introduction
This blog post demonstrates how Graytoo can help screen for potential relationships and efficiently source relevant data.
Starting with Core Data
We begin by analyzing the Consumer Price Index (CPI) data from FRED (CPIAUCSL series) and converting it to inflation rates. After uploading this inflation series to Graytoo's search engine, we explore contemporaneous relationships using the causality search option.
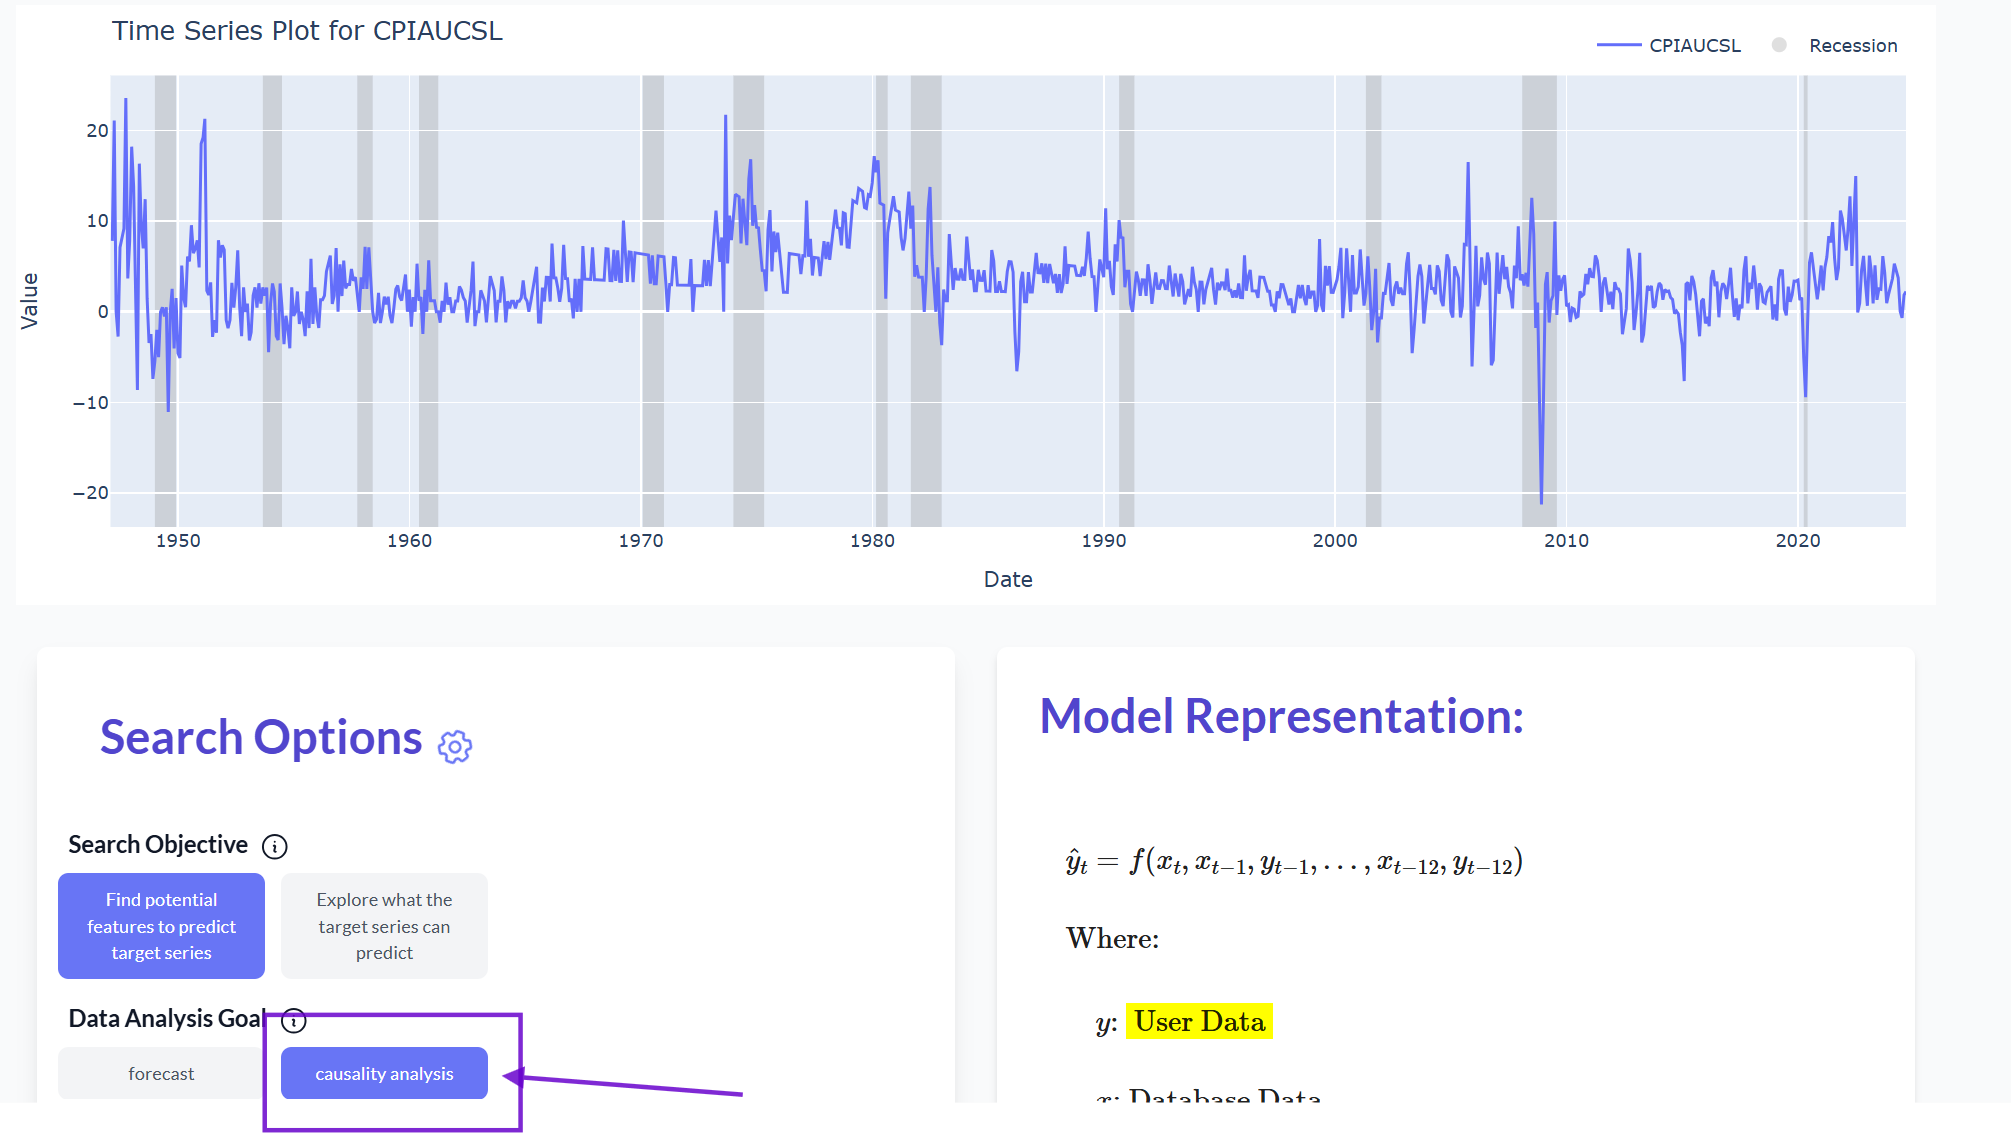
Figure 1: Choosing Casualty option from Search Option
The inflation series exhibits I(1) characteristics and currently hovers around 2%, indicating the Federal Reserve's successful inflation management compared to historical levels.
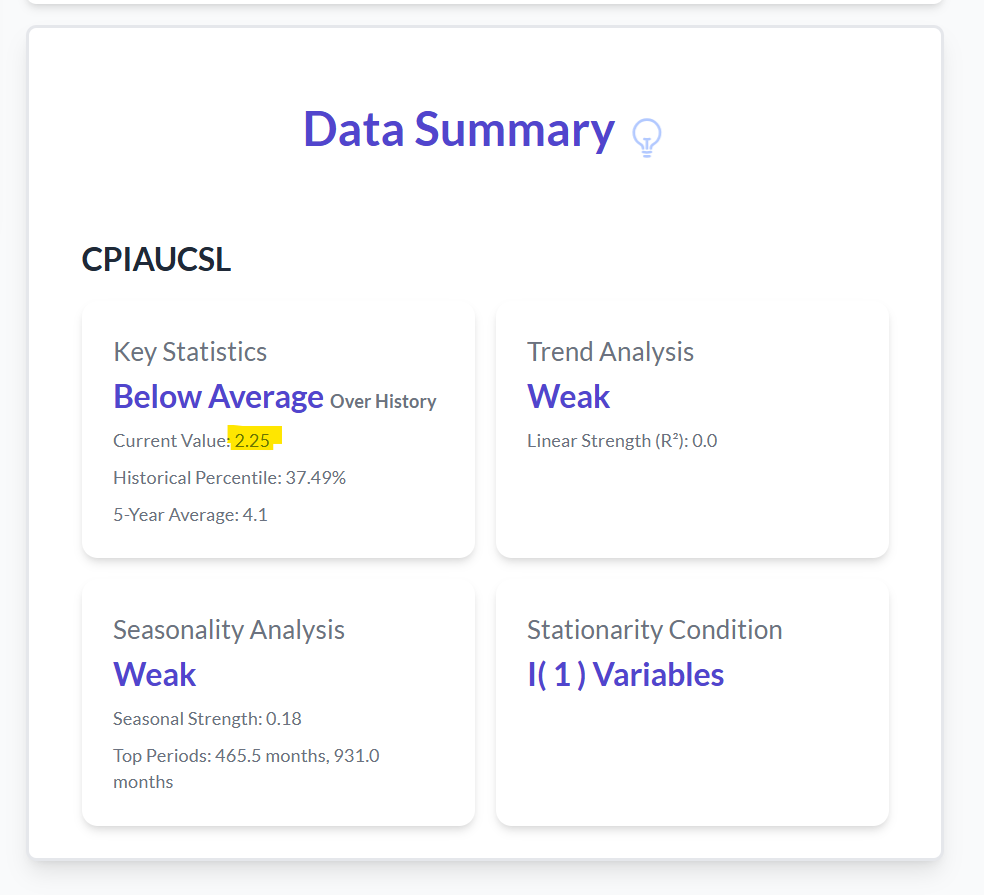
Figure 2: Upload Data Summary, indicating currently below average value for inflation
Search Results
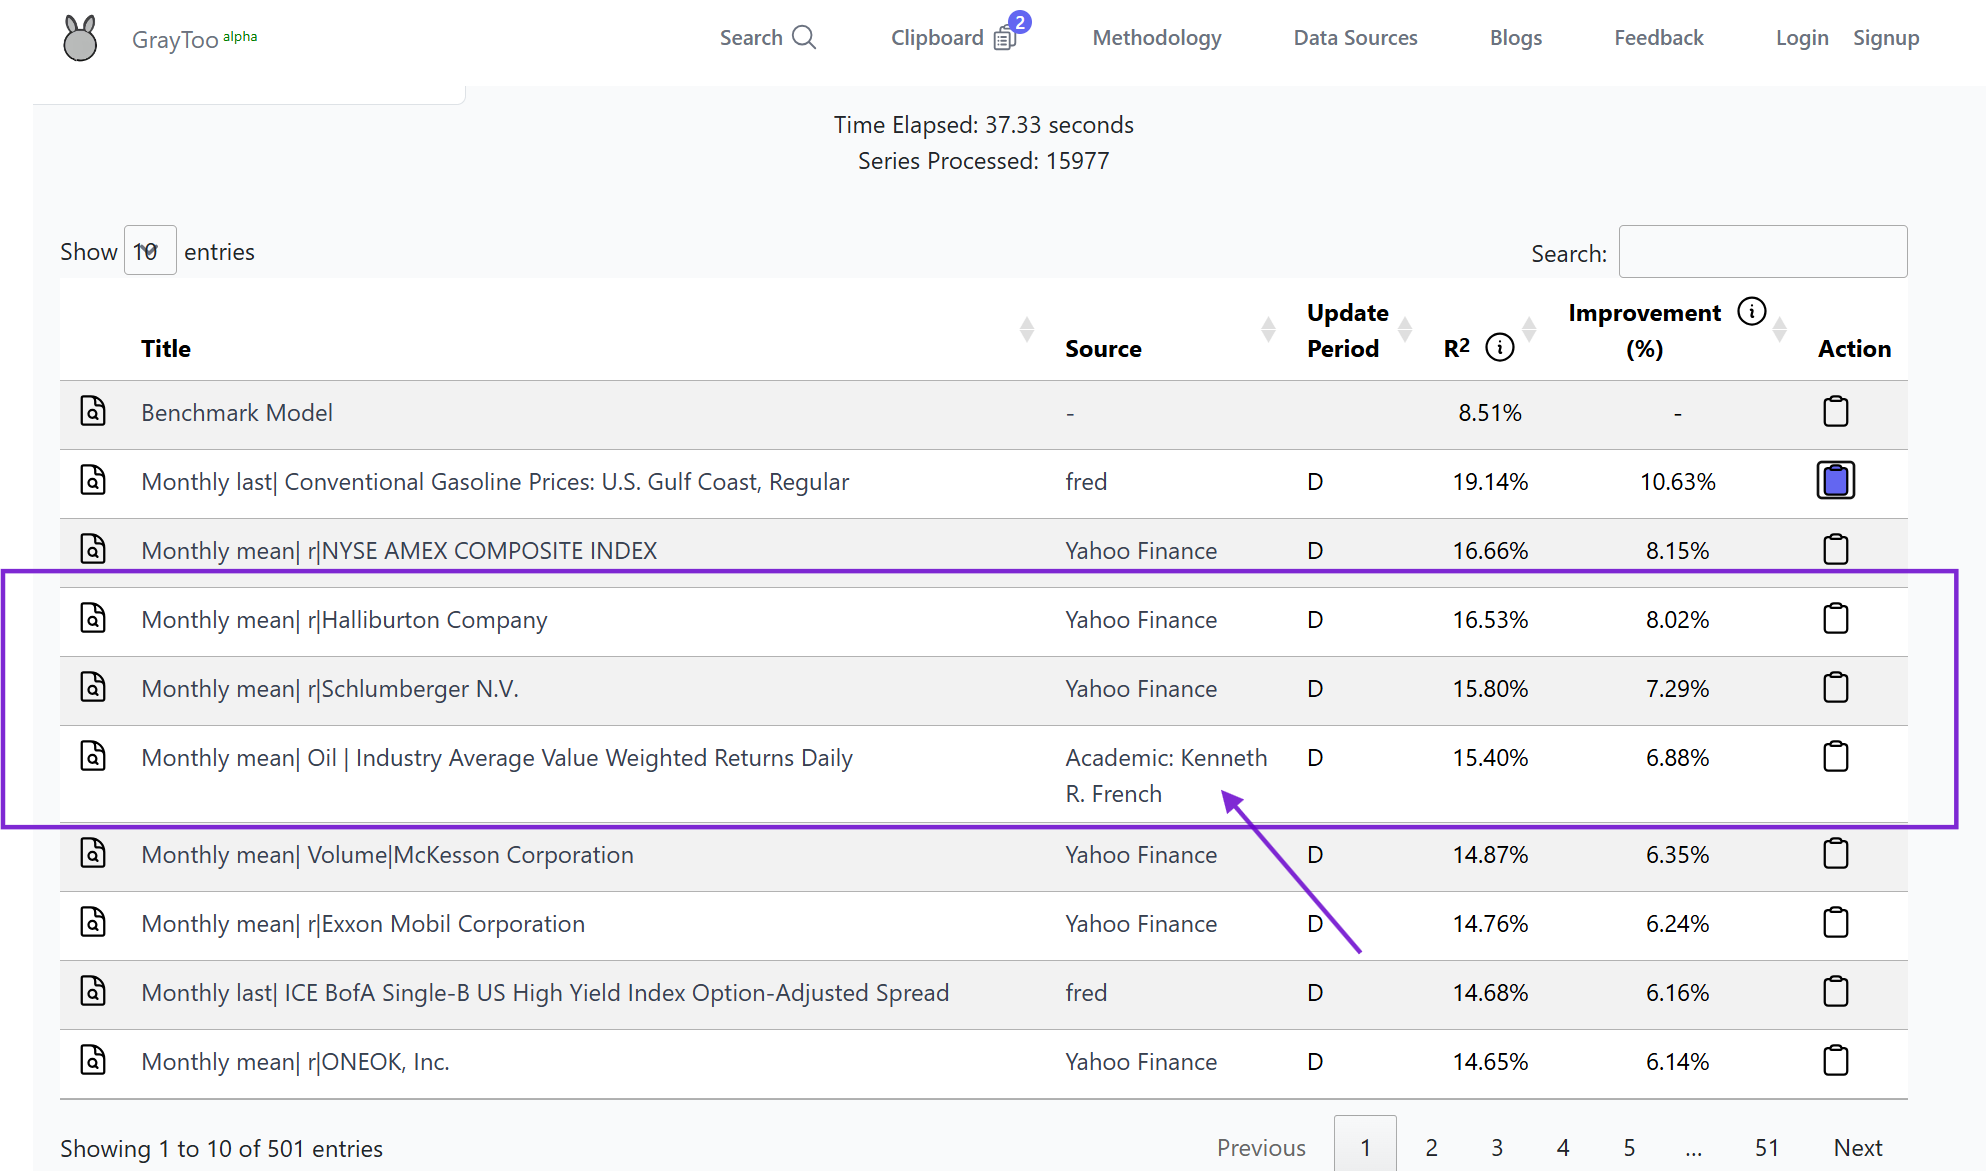
Figure 3: Query result for potential variables that can explain inflation variability
While it's well-known that oil prices significantly impact inflation1, our search results revealed something less obvious: strong correlations with certain companies' equity returns. The top results included:
- Oil industry giants: Halliburton, Schlumberger N.V., and Exxon Mobil
- Healthcare sector: McKesson Corporation
From Correlation to Data Collection
This discovery suggests two potential features for analyzing inflation:
- Direct price indicators: Conventional Gasoline Prices (DGASUSGULF from FRED)
- Market-based indicators: Oil Industry Average Value-Weighted Returns (from Kenneth French's Data Library)
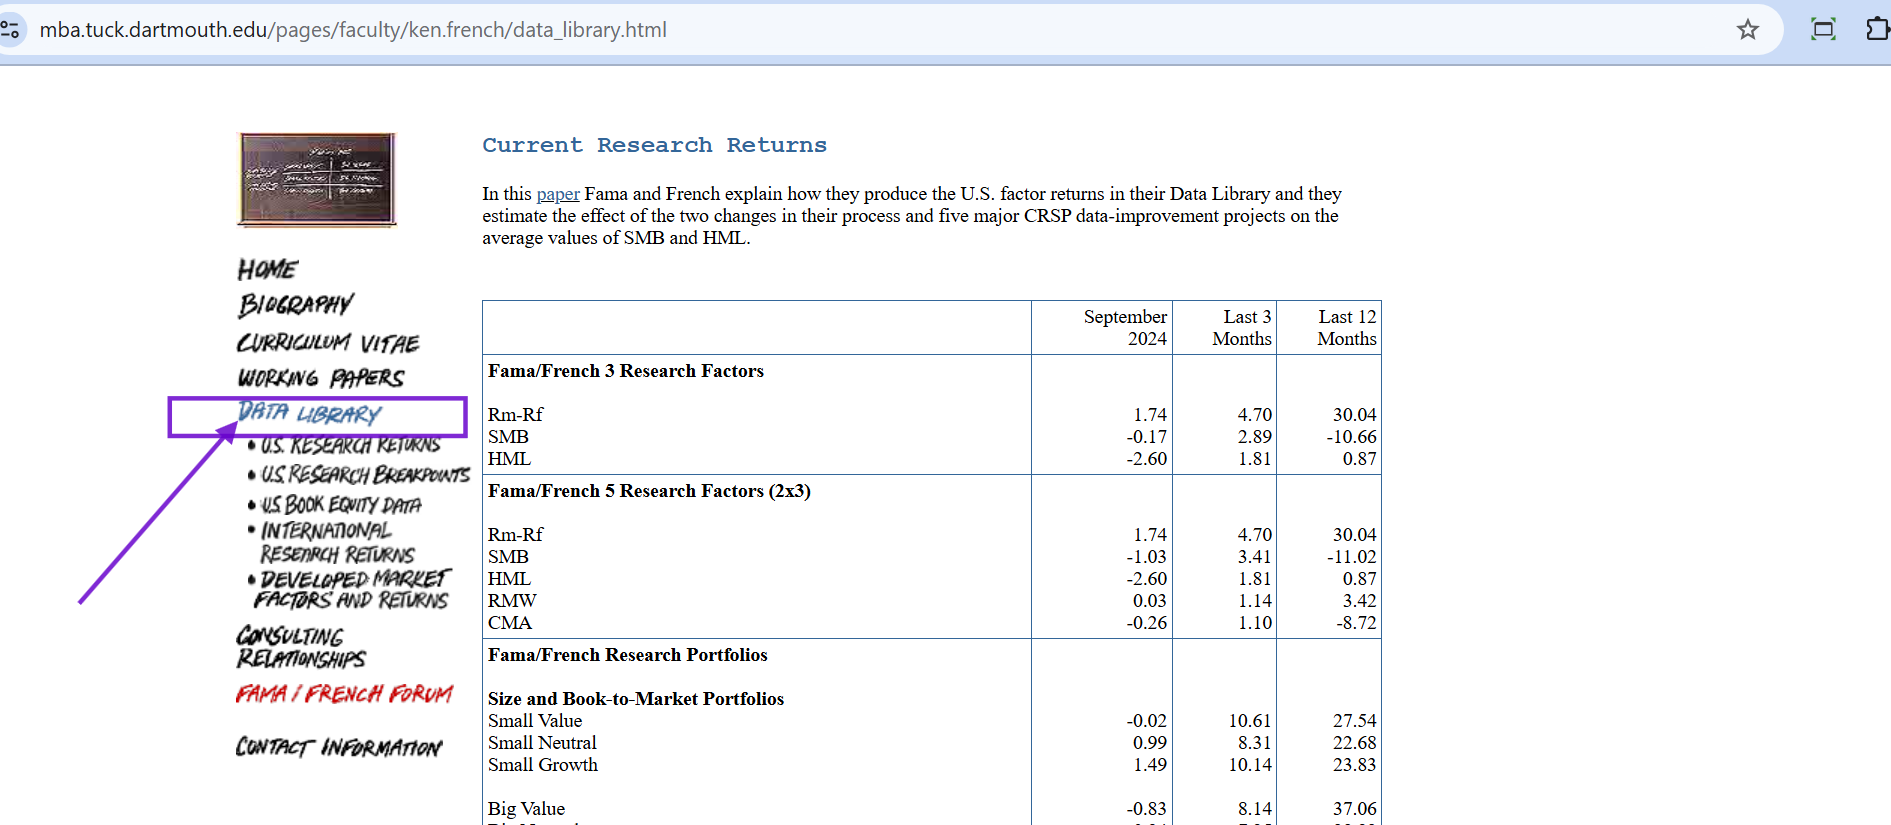
Figure 4: Kenneth French's Data Library Website that can be obtained from Data Source
Why This Matters
This example highlights two key advantages of using Graytoo:
- Feature Discovery: Instead of relying on predetermined keywords, Graytoo uses data relationships to identify potential explanatory variables, revealing connections like the oil industry equity returns.
- Efficient Data Sourcing: The platform directly links to original data sources, streamlining the data collection process for further analysis.
Conclusion
Graytoo's data-driven approach to feature discovery goes beyond conventional keyword searches, potentially revealing overlooked relationships in economic data. By combining this with easy access to primary data sources, it enables more comprehensive and efficient economic analysis.
1 WorldBank: "Oil price shocks were the main drivers of variation in global inflation with a contribution of over 38 percent, followed by global demand shocks with a contribution of about 28 percent over the past five decades, and much smaller contributions of global supply shocks and interest rate shocks. Impulse responses also suggest a more significant role for oil prices and global demand shocks."