How to Use
Objective: Identifying Endogenous Variables (y) Using User-Defined Data as Exogenous Variables (X)
This guide demonstrates how to use the explore option to identify potential endogenous variables (y) that the Fear & Greed Index might help predict. For a more detailed analysis, please refer to the blog post:
Fear and Greed Index: Does it Help Predicting Securities Return?
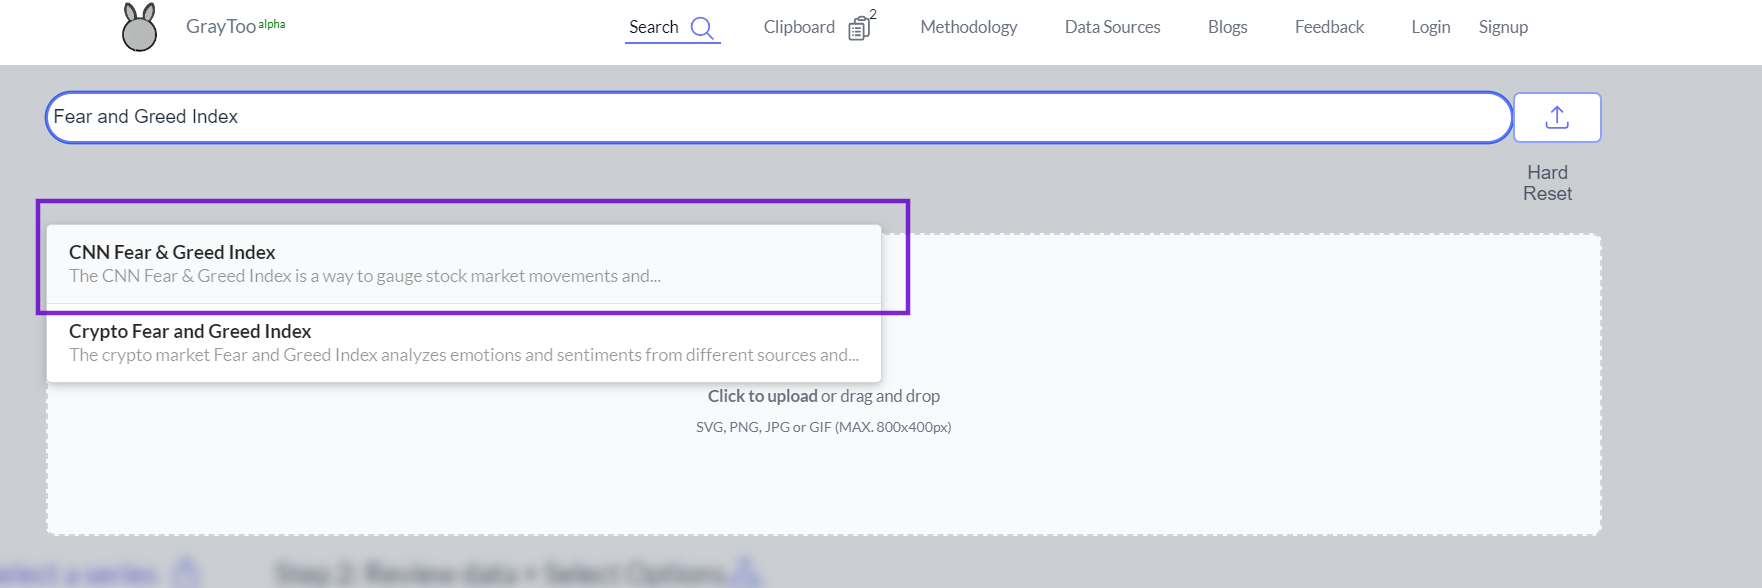
1. Data Selection:
Users can either upload their own data or utilize the existing database. In this example, we'll use the Fear & Greed Index from CNN.
 2. Main Interface:
After data selection, three main panels are presented:
2. Main Interface:
After data selection, three main panels are presented:
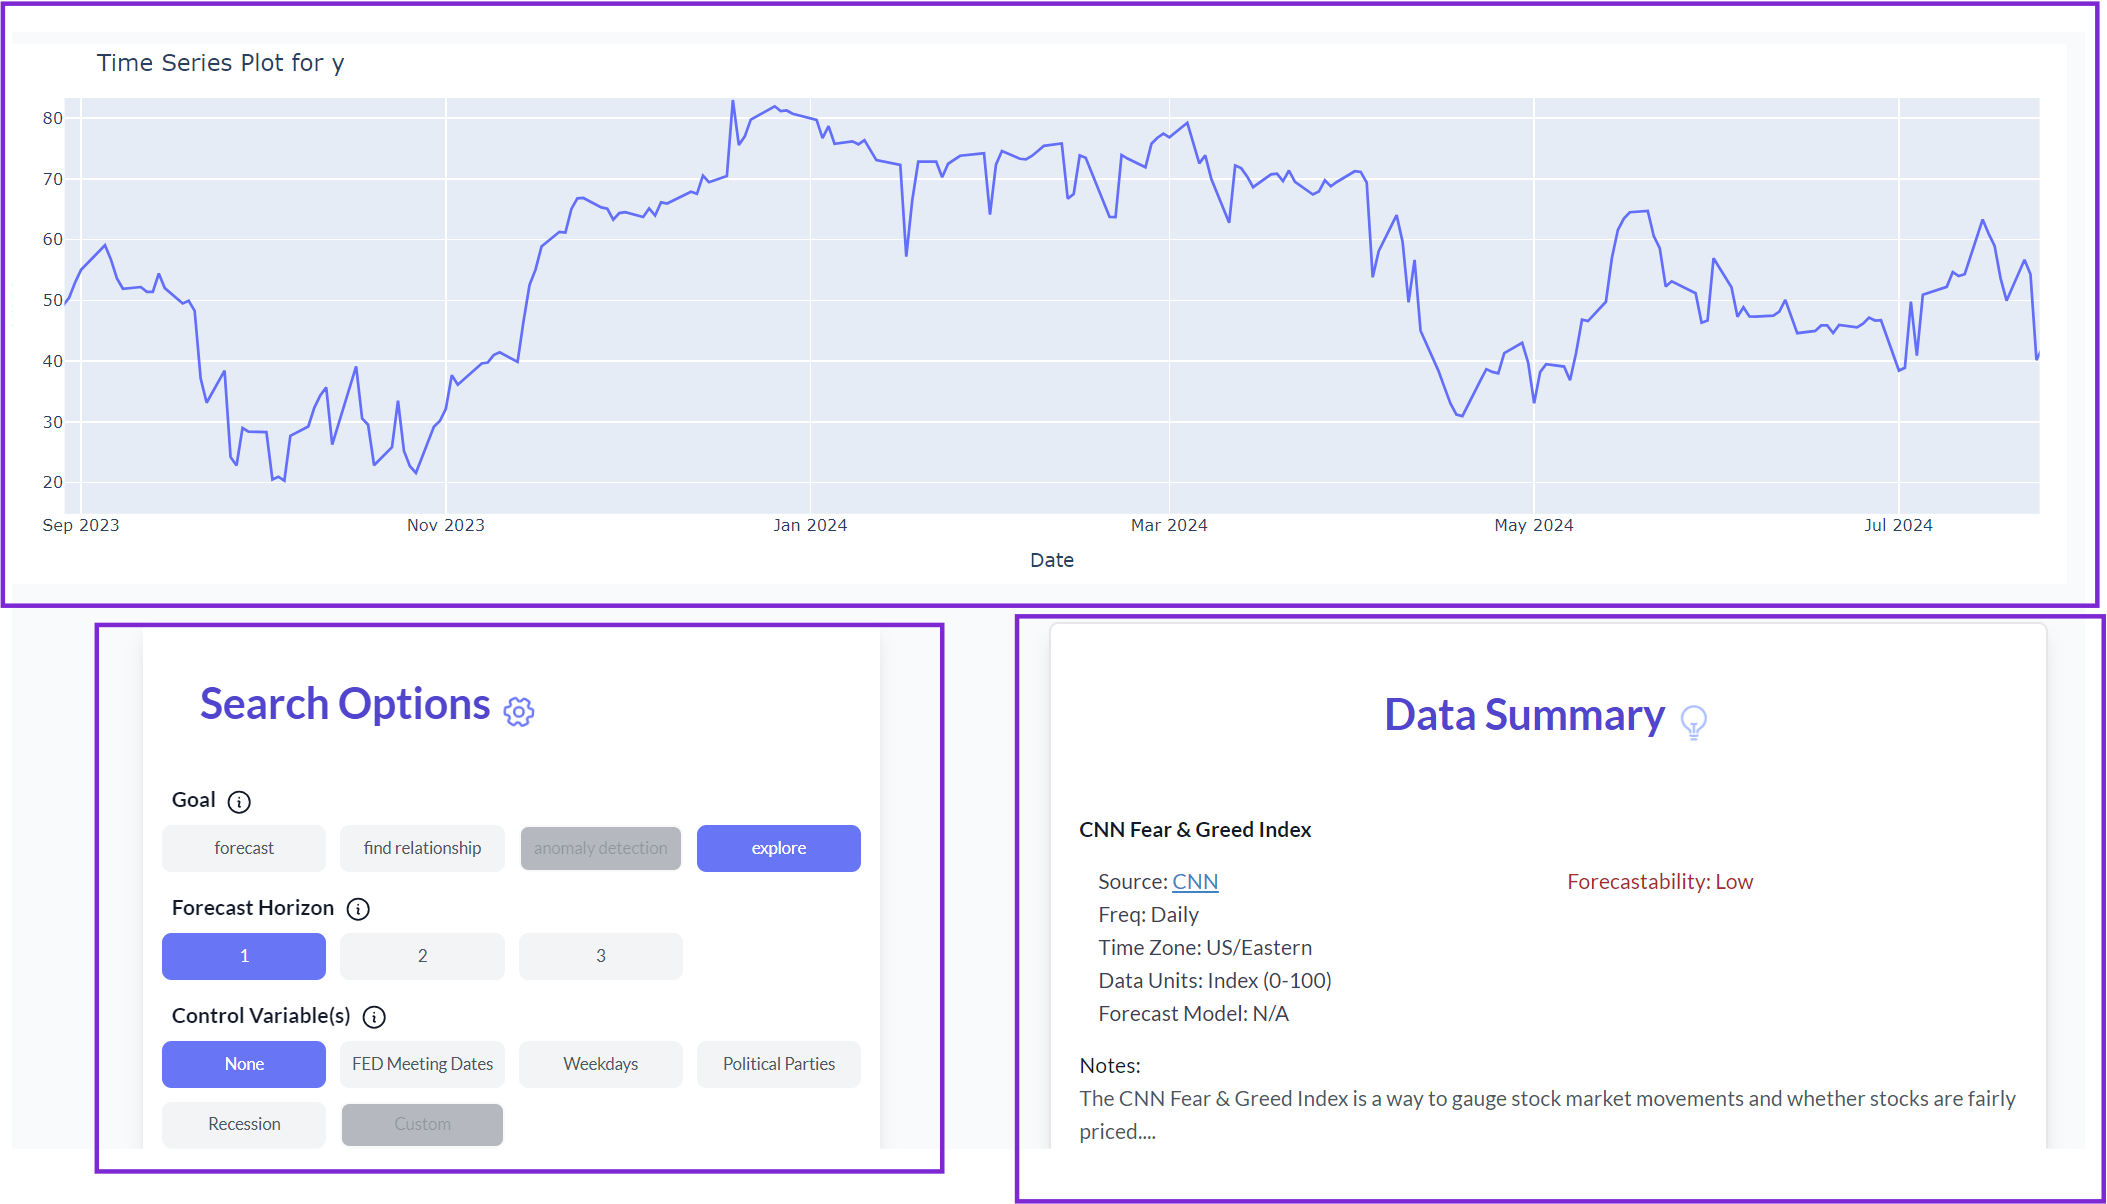 a) Time series plot of the target variable (Fear & Greed Index in this case)
b) Search options for customization
c) Summary of the selected data
3. Search Configuration:
Select the "Explore" option from the search panel.
a) Time series plot of the target variable (Fear & Greed Index in this case)
b) Search options for customization
c) Summary of the selected data
3. Search Configuration:
Select the "Explore" option from the search panel.
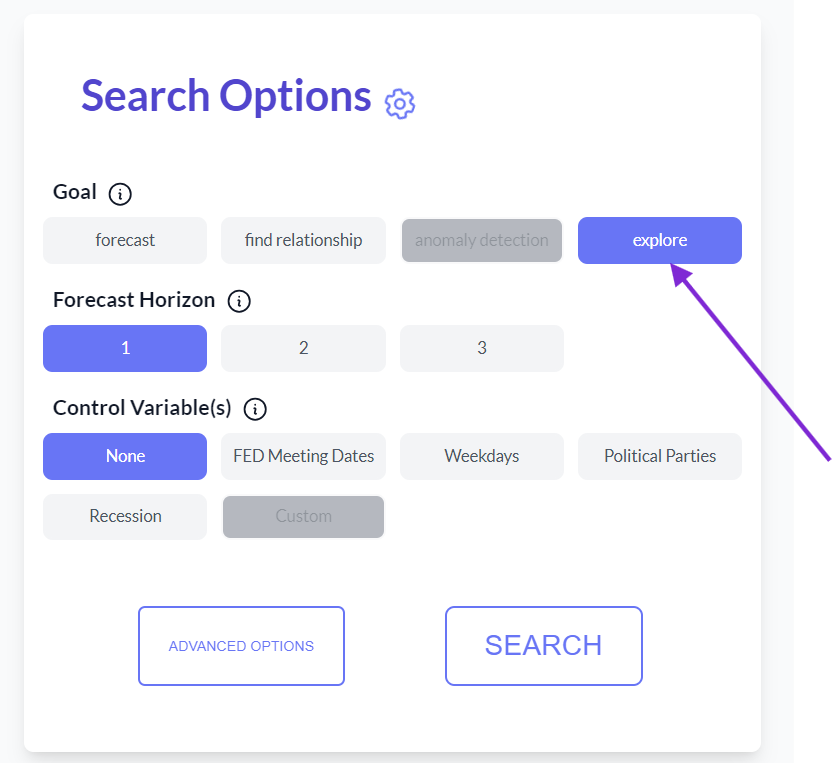 The default horizon is set to 1, which is suitable for identifying immediate future predictions. Maintain this setting.
4. Initiating the Search:
Click the search button to begin the analysis.
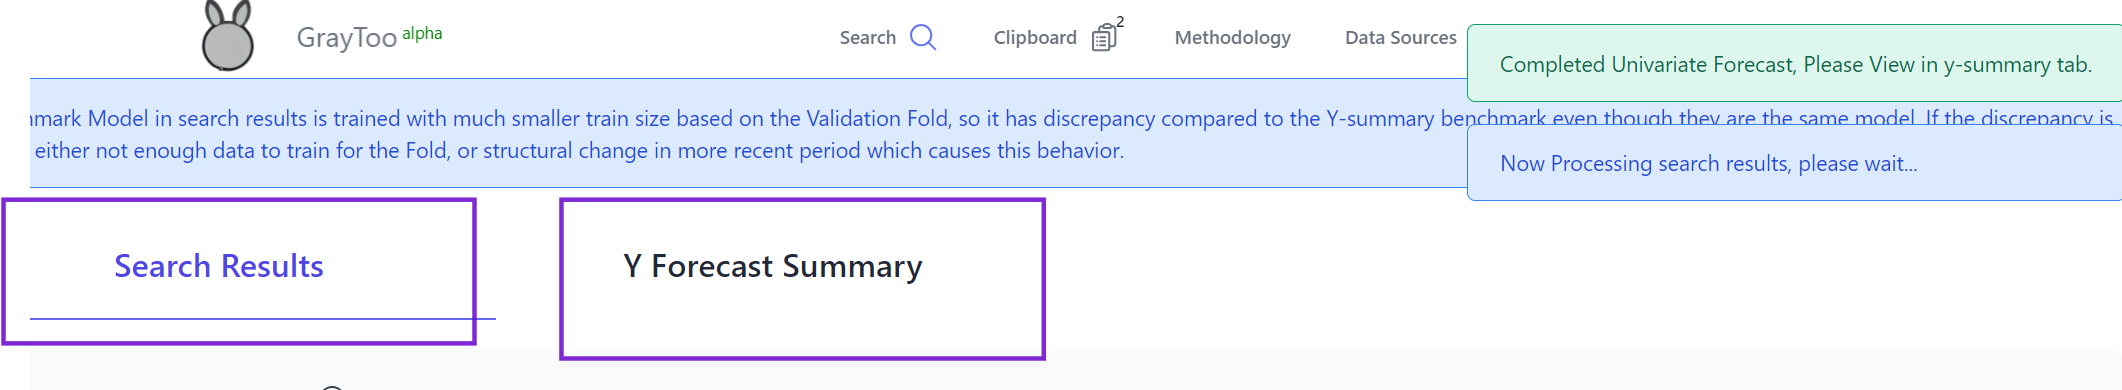
5. Results Analysis:
Two tabs are available: search results and target variable summary. Progress messages appear on the right side.
The default horizon is set to 1, which is suitable for identifying immediate future predictions. Maintain this setting.
4. Initiating the Search:
Click the search button to begin the analysis.
5. Results Analysis:
Two tabs are available: search results and target variable summary. Progress messages appear on the right side.
 The target summary provides basic statistics about the Fear & Greed Index and the system-generated forecast used in the search algorithm.
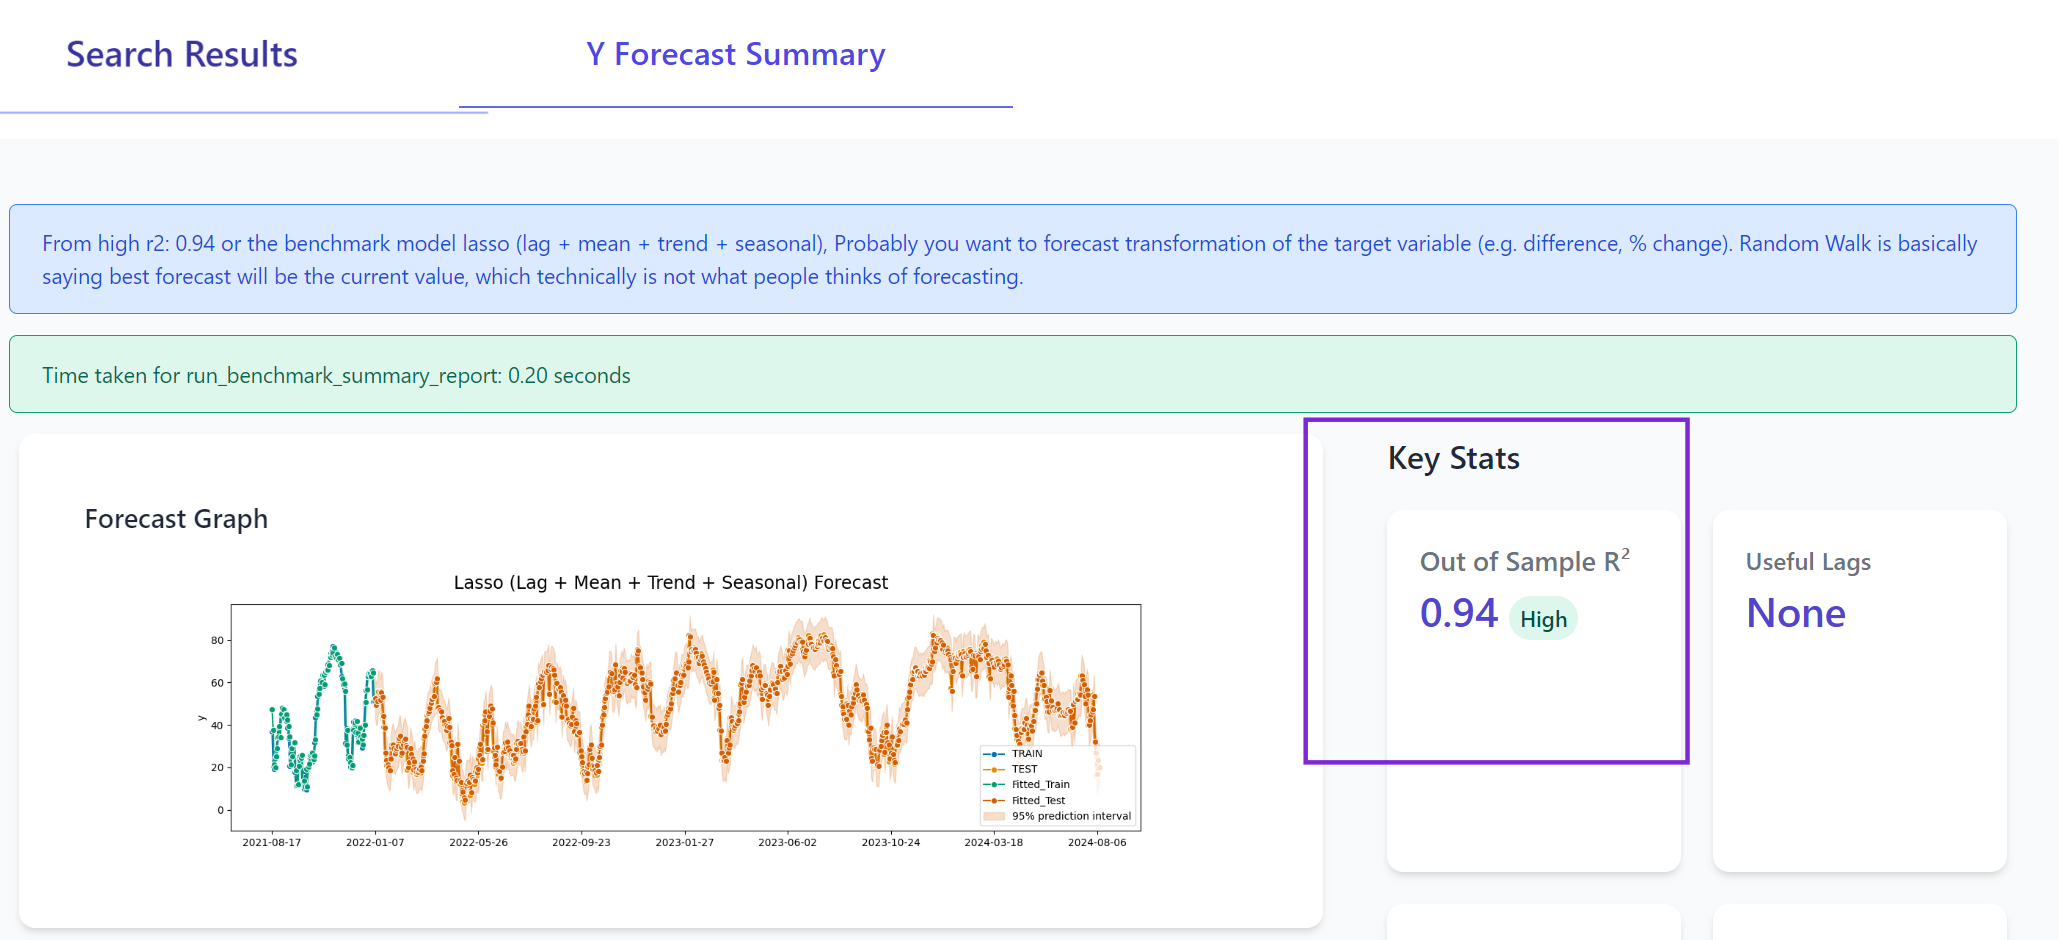 Note: The high R² for the index is expected.
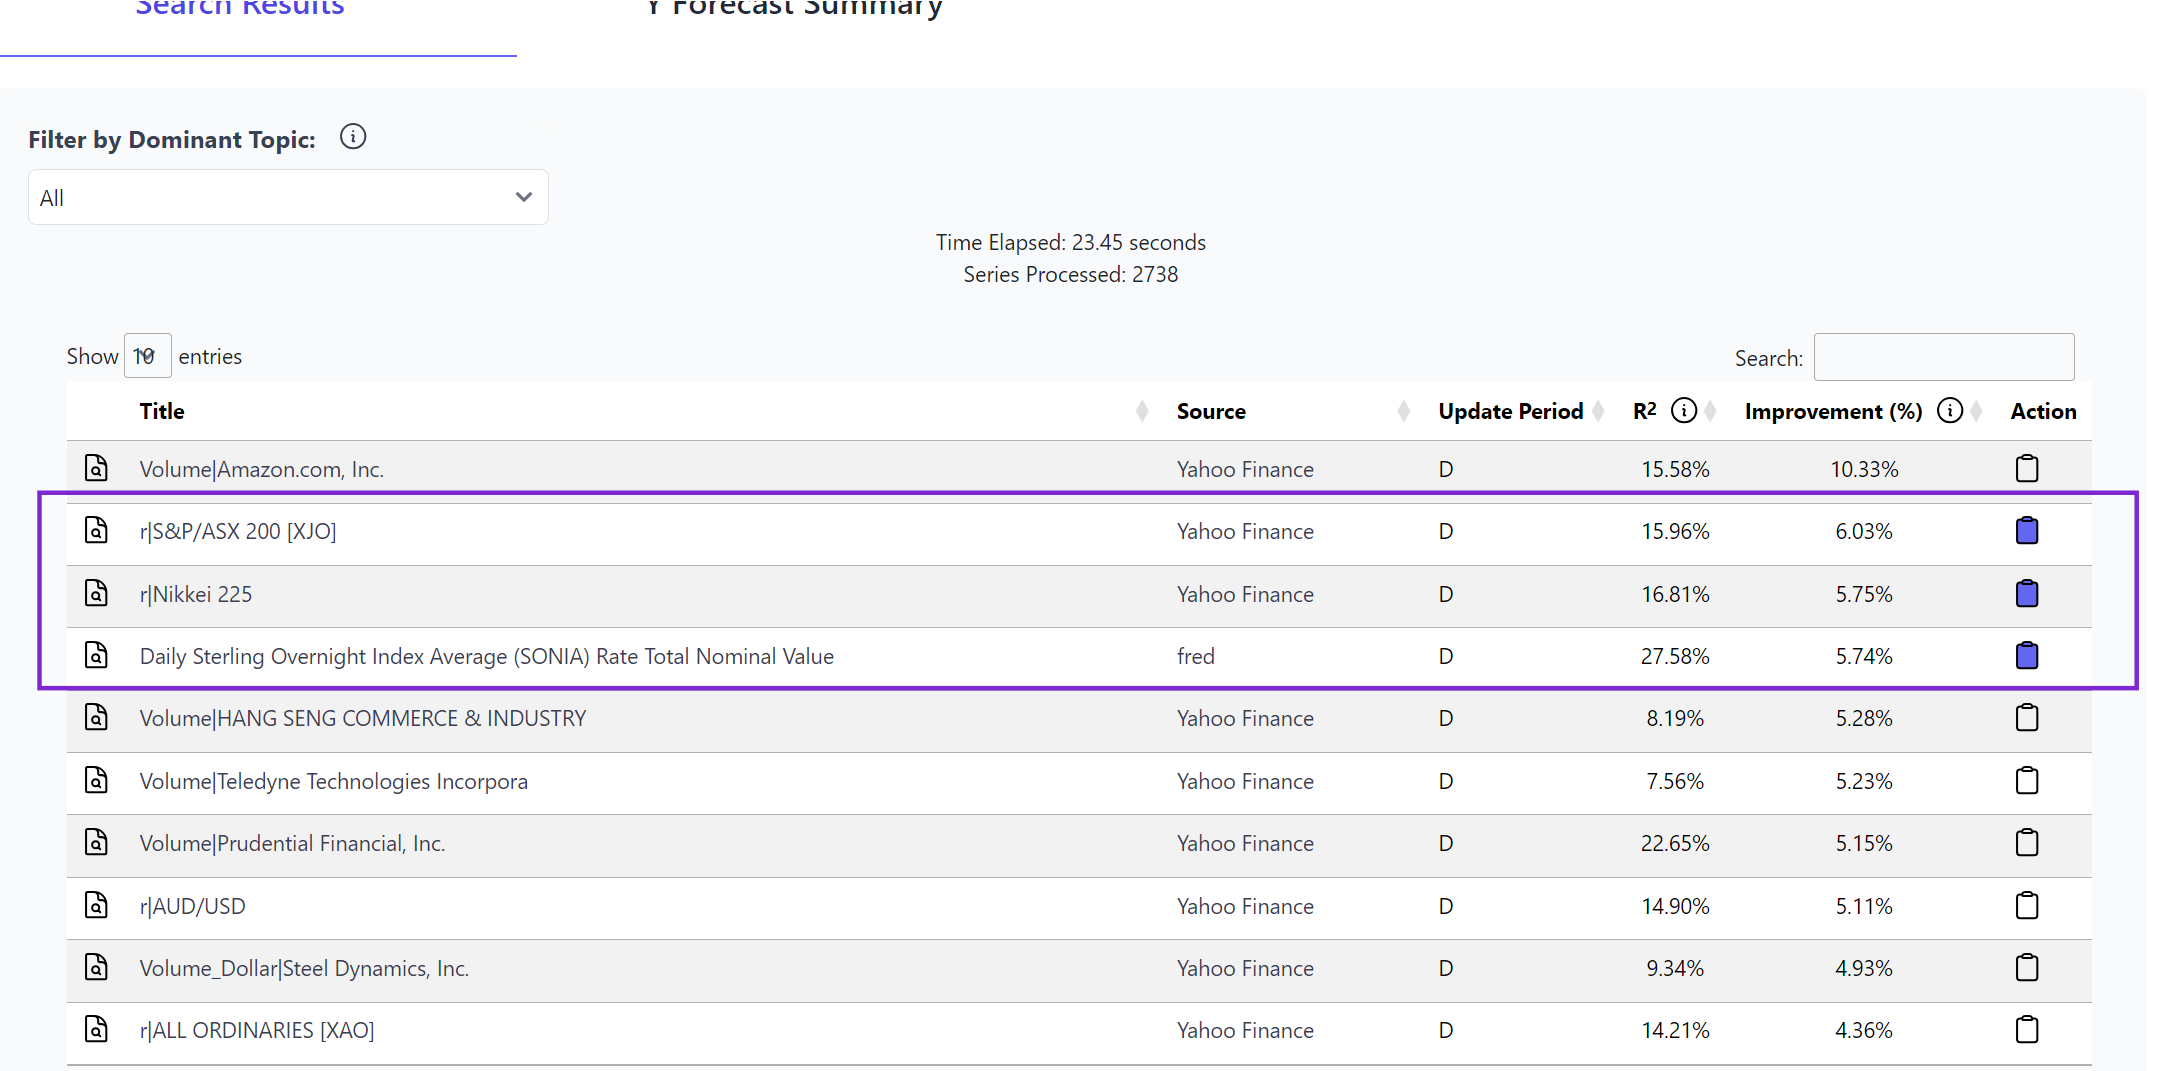
6. Search Results:
The search results tab displays potential series that the Fear & Greed Index might help predict, including data information and estimated R² improvements compared to each series' own benchmark model.
Note: The high R² for the index is expected.
6. Search Results:
The search results tab displays potential series that the Fear & Greed Index might help predict, including data information and estimated R² improvements compared to each series' own benchmark model.
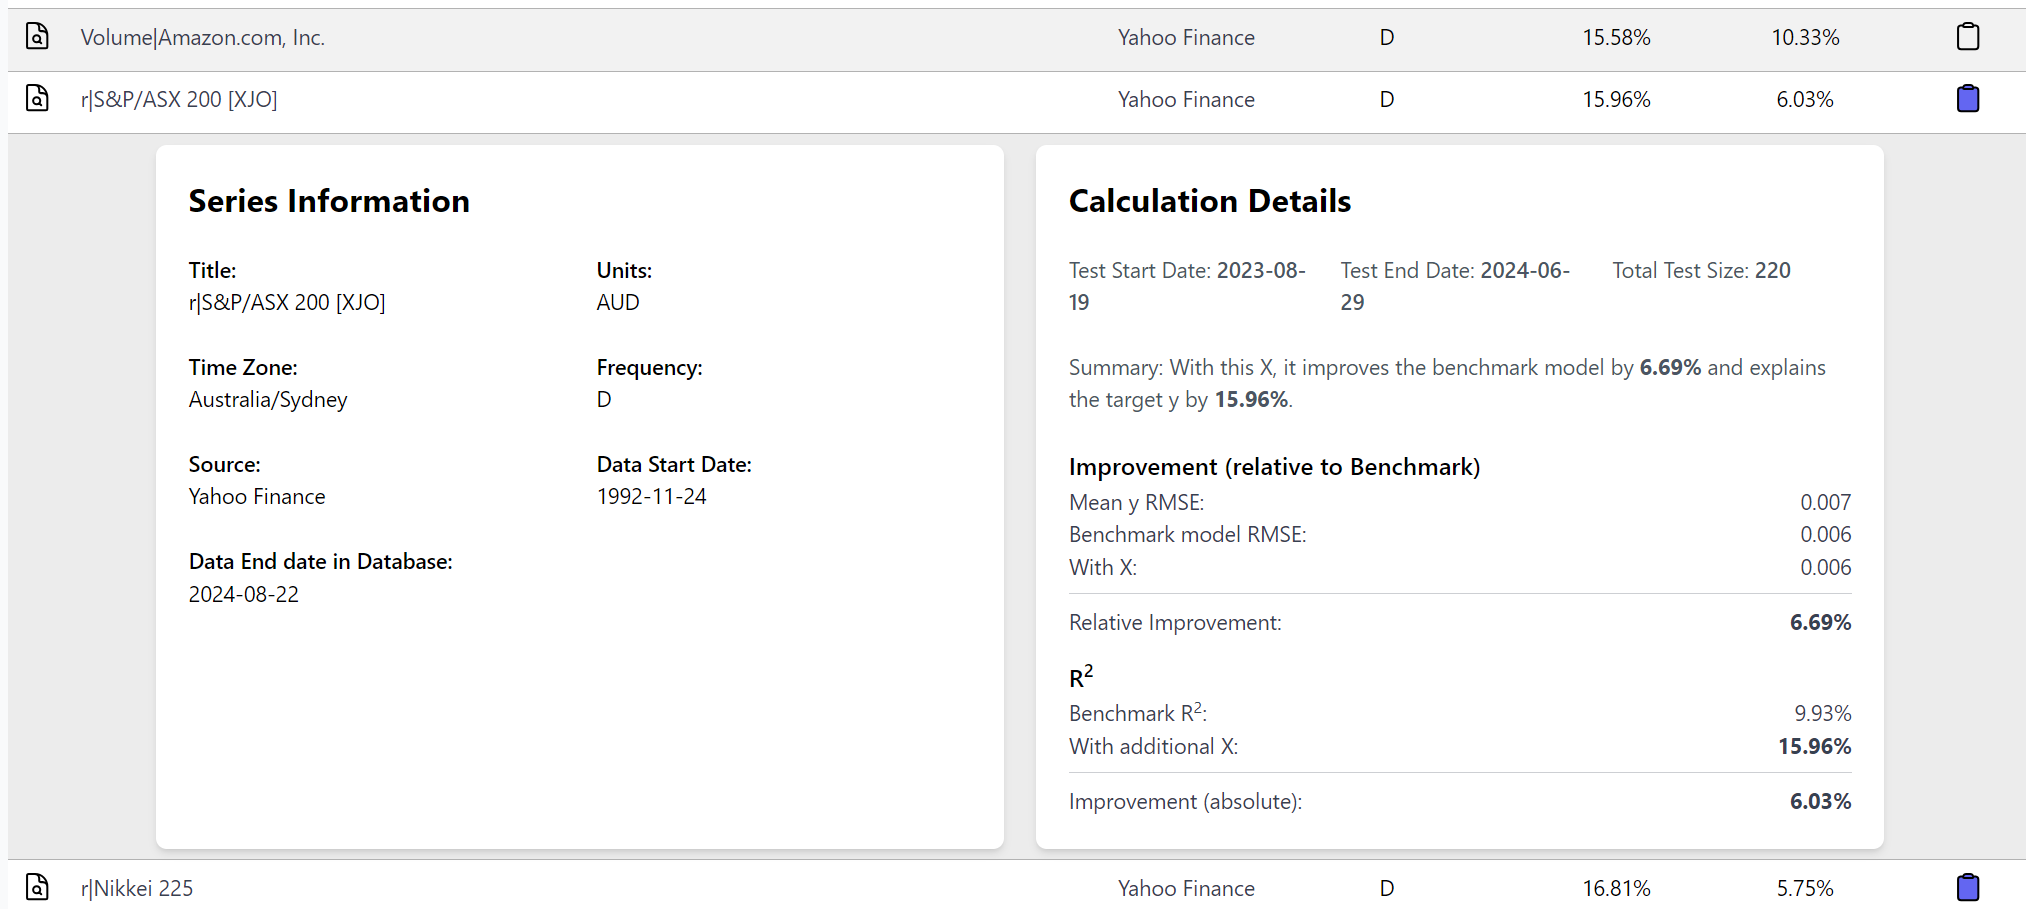
 Click on a row to view details of the R² calculation and series information.
 The "Improvement %" column shows the R² improvement compared to the benchmark model. In this example, the improvement from including the Fear and Greed Index and its lags is modest.
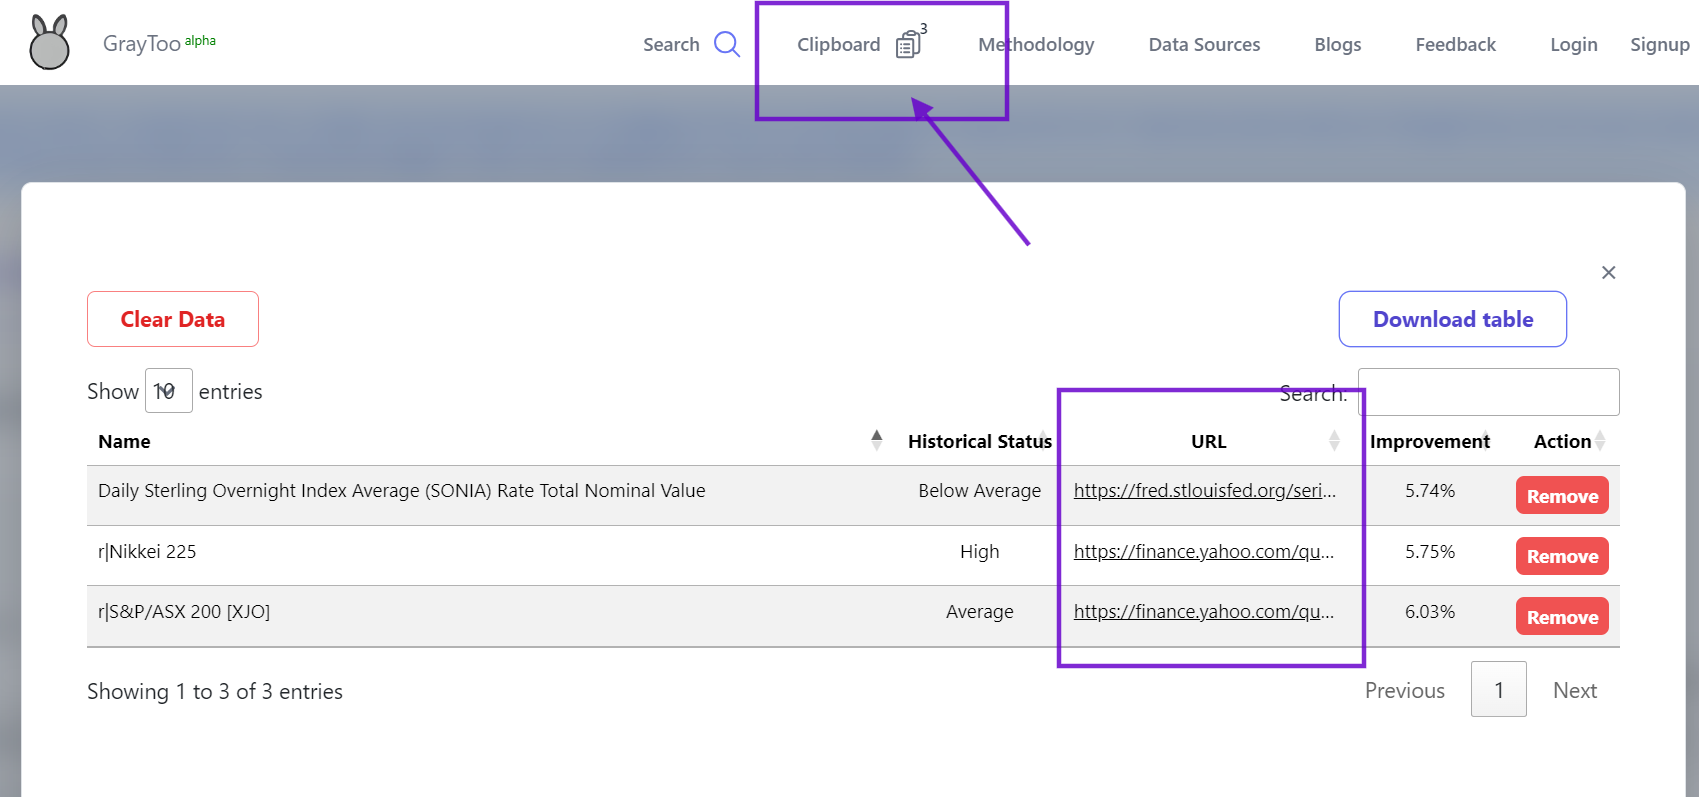
7. Saving and Analyzing Results:
To save series for later analysis:
a) Click on rows of interest in the results table.
b) Click the clipboard button next to each series to save.
c) Access the clipboard icon at the top of the page to view saved series.
d) Download selected results or view them in the clipboard.
e) Click individual rows in the clipboard view for more details, including the data source.
The "Improvement %" column shows the R² improvement compared to the benchmark model. In this example, the improvement from including the Fear and Greed Index and its lags is modest.
7. Saving and Analyzing Results:
To save series for later analysis:
a) Click on rows of interest in the results table.
b) Click the clipboard button next to each series to save.
c) Access the clipboard icon at the top of the page to view saved series.
d) Download selected results or view them in the clipboard.
e) Click individual rows in the clipboard view for more details, including the data source.
 This exploration process allows for the identification of potential predictive relationships between the target series (Fear & Greed Index) and other financial or economic indicators. It highlights areas where the Fear & Greed Index might provide valuable information for forecasting or analysis.
By following these steps, users can effectively utilize the explore option to uncover potential endogenous variables influenced by their chosen exogenous variable, facilitating deeper insights and more comprehensive financial analysis.
For additional use cases, please refer to the blog posts section:
Blogs - Anomalies Detection
This exploration process allows for the identification of potential predictive relationships between the target series (Fear & Greed Index) and other financial or economic indicators. It highlights areas where the Fear & Greed Index might provide valuable information for forecasting or analysis.
By following these steps, users can effectively utilize the explore option to uncover potential endogenous variables influenced by their chosen exogenous variable, facilitating deeper insights and more comprehensive financial analysis.
For additional use cases, please refer to the blog posts section:
Blogs - Anomalies Detection