How to Use
Data Analysis Goal: Forecasting - Finding Exogenous Variables (x) to Improve Forecast Accuracy
This guide outlines the process of using the search engine to improve forecast accuracy by identifying relevant exogenous variables.
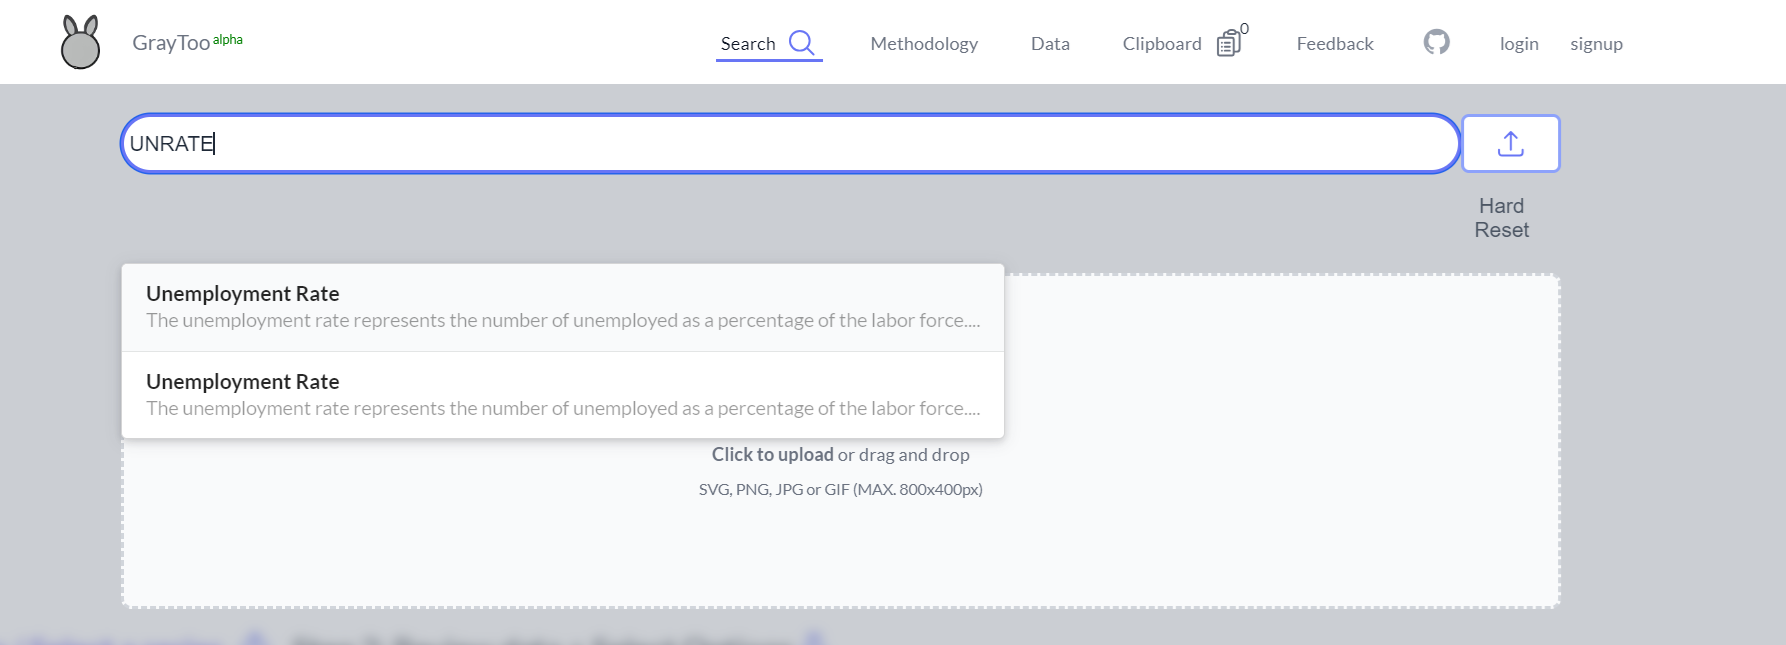
1. Data Selection:
Users can either upload their own data or utilize the existing database. In this example, we'll use the Unemployment Rate from FRED.
 2. Main Interface:
After data selection, three main panels are presented:
2. Main Interface:
After data selection, three main panels are presented:
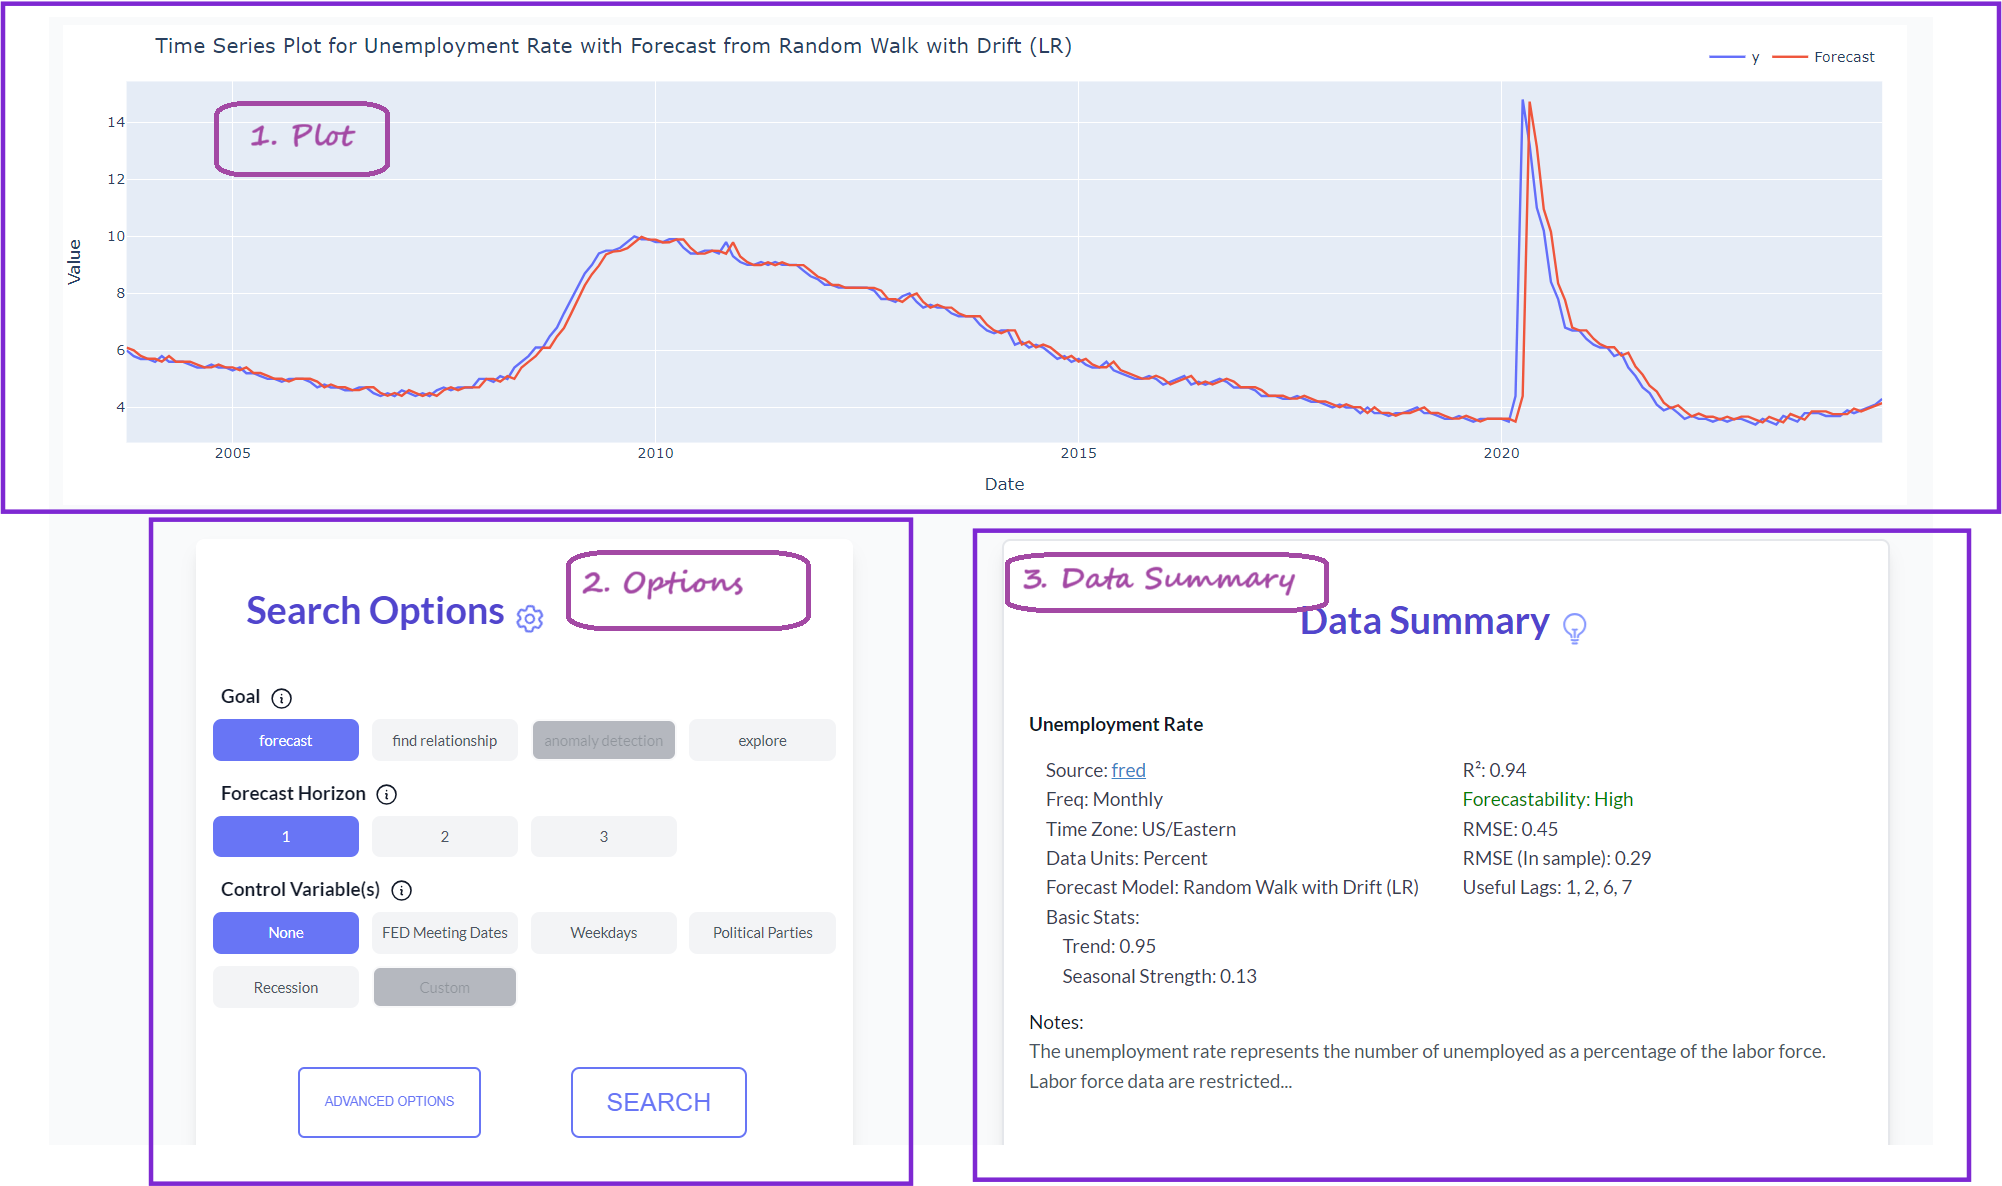 a) Time series plot of the target variable (including a rolling forecast for database entries)
b) Search options for customization
c) Summary of the selected data
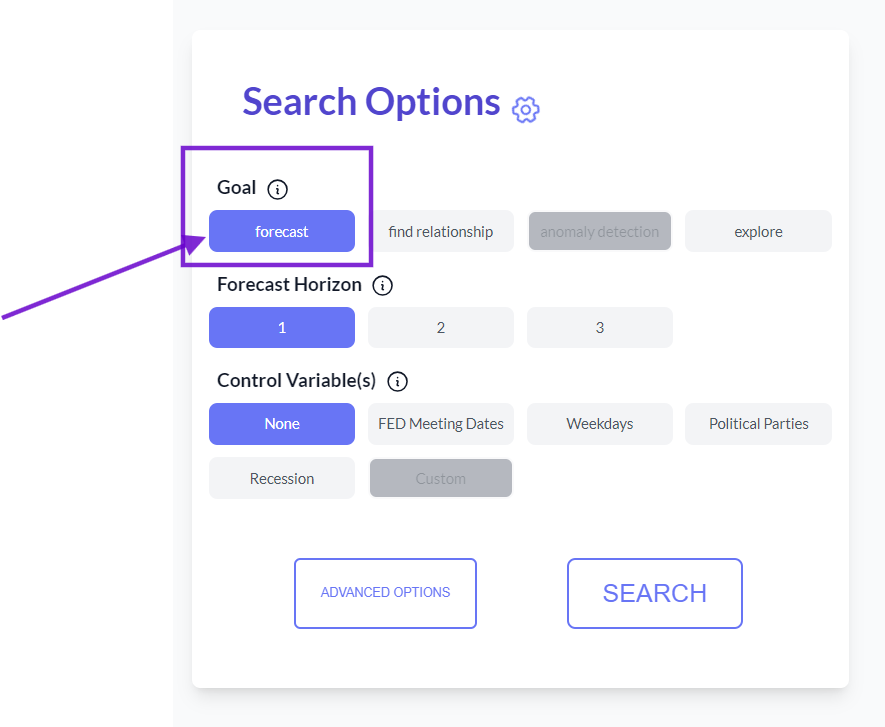
3. Search Configuration:
For this example, we'll forecast the unemployment rate for the next month, maintaining the default options (forecast with horizon = 1).
a) Time series plot of the target variable (including a rolling forecast for database entries)
b) Search options for customization
c) Summary of the selected data
3. Search Configuration:
For this example, we'll forecast the unemployment rate for the next month, maintaining the default options (forecast with horizon = 1).
 4. Advanced Settings:
Users can control variables and adjust search algorithms as needed.
4. Advanced Settings:
Users can control variables and adjust search algorithms as needed.
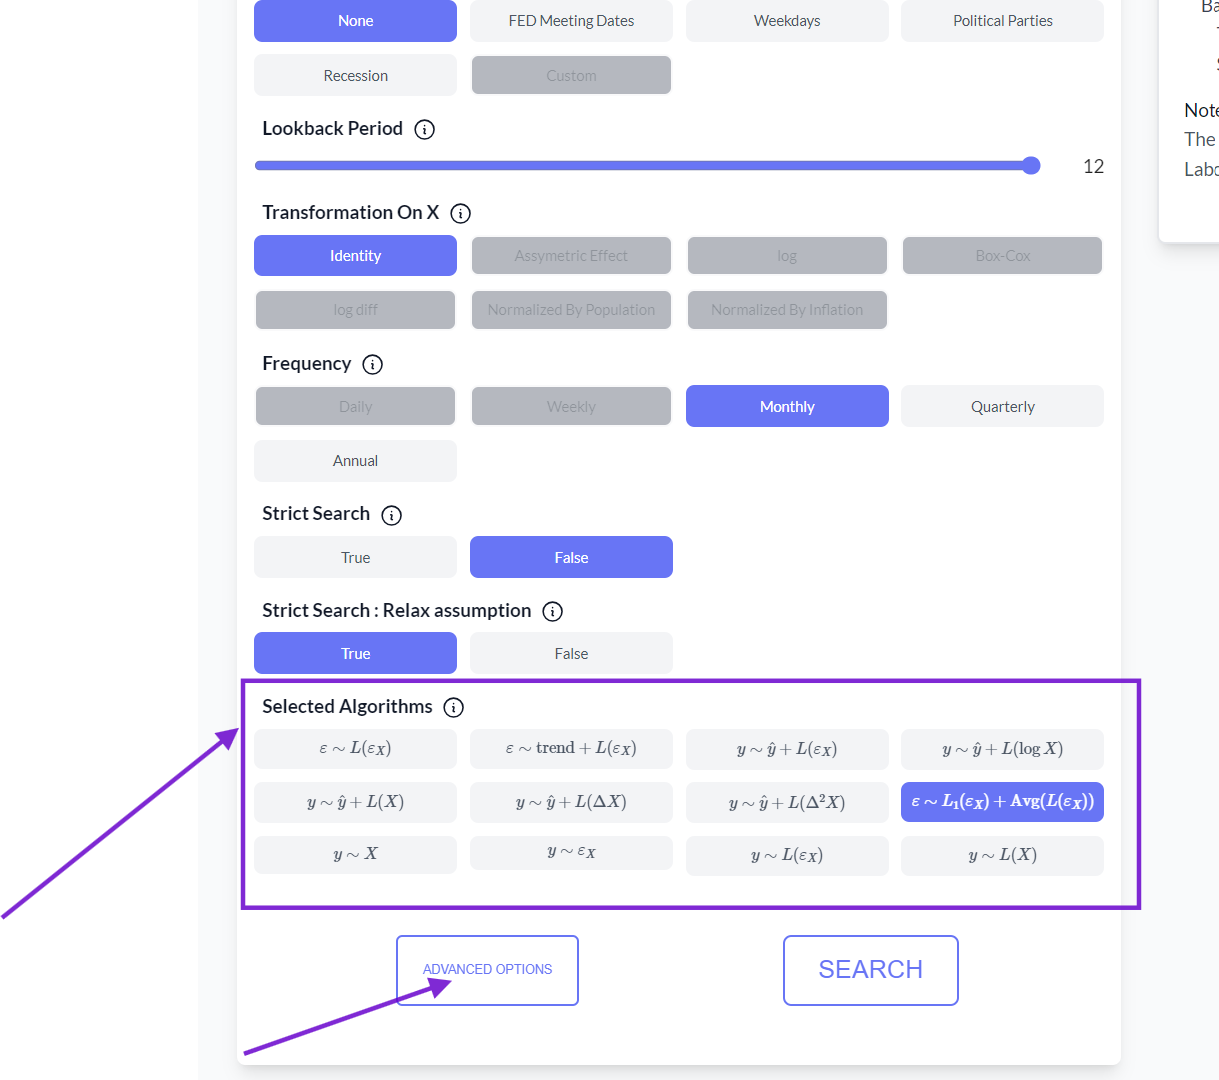 The default search method uses ridge regression with penalties. Users can define input variables and select the number of lags for the search algorithm.
5. Initiating the Search:
After configuring options, click the search button to begin.
The default search method uses ridge regression with penalties. Users can define input variables and select the number of lags for the search algorithm.
5. Initiating the Search:
After configuring options, click the search button to begin.
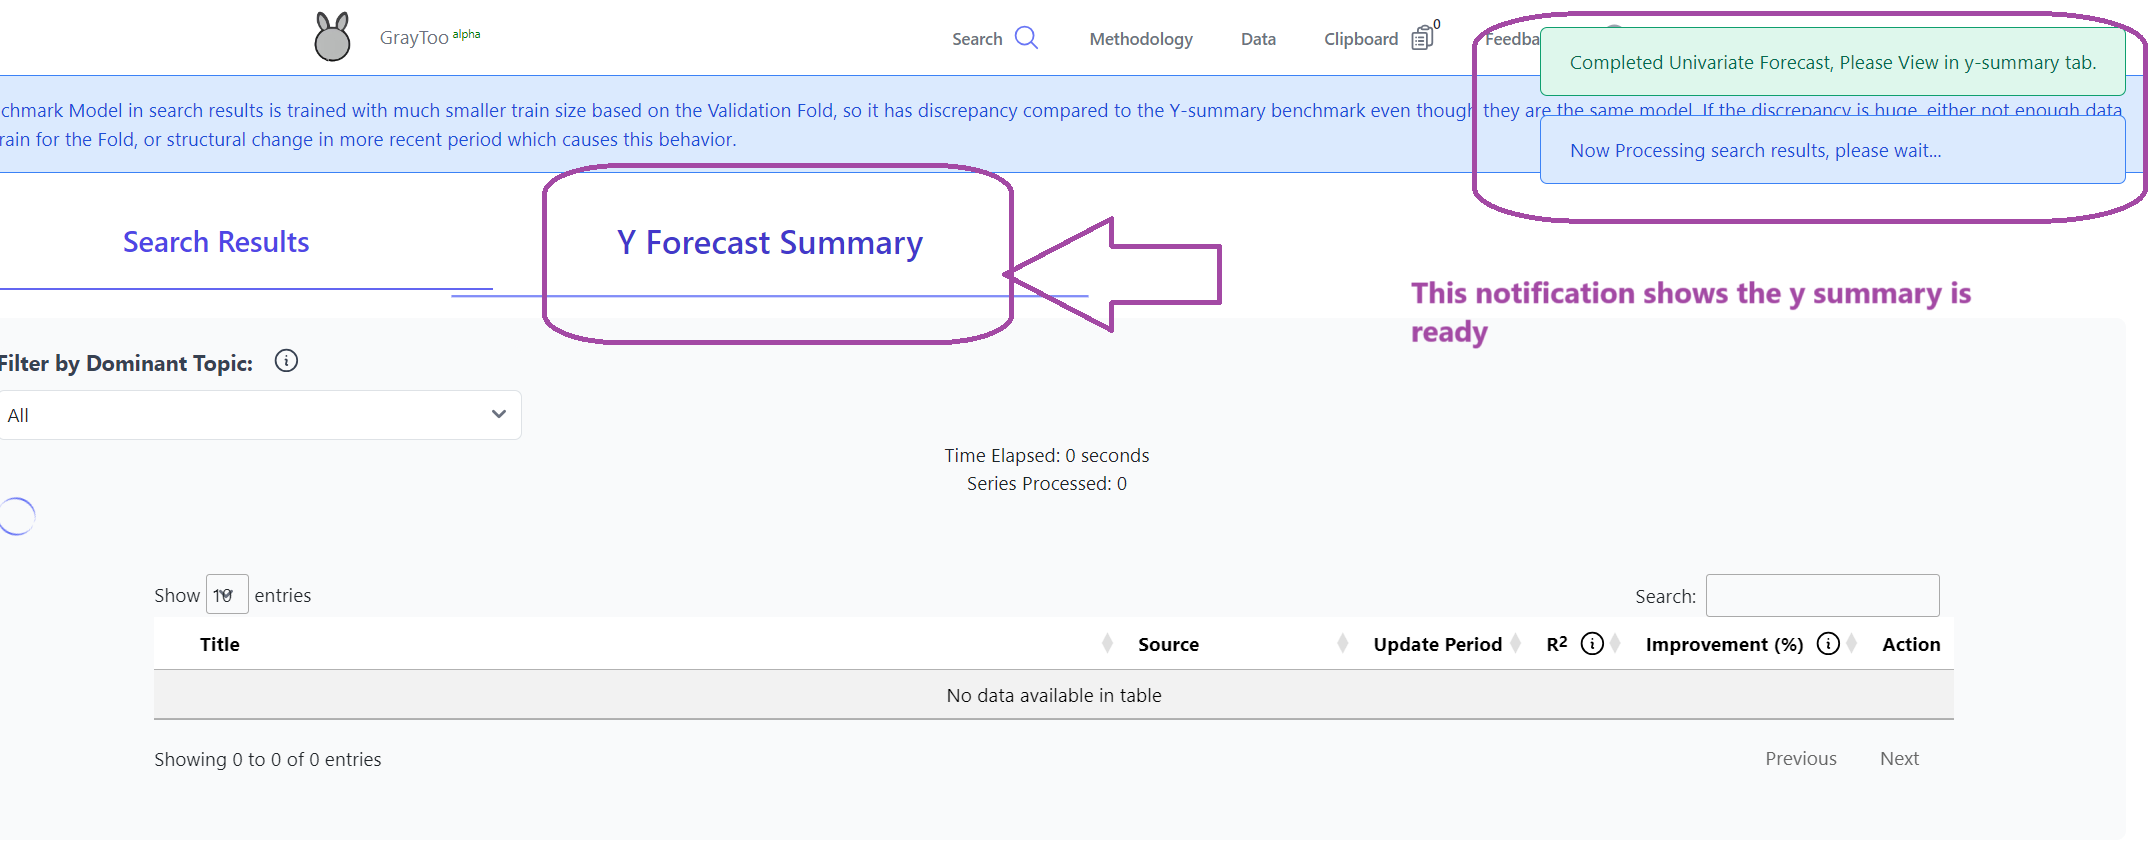 6. Results Analysis:
Two tabs are available: search results and target variable forecast summary. Progress messages appear on the right side.
6. Results Analysis:
Two tabs are available: search results and target variable forecast summary. Progress messages appear on the right side.
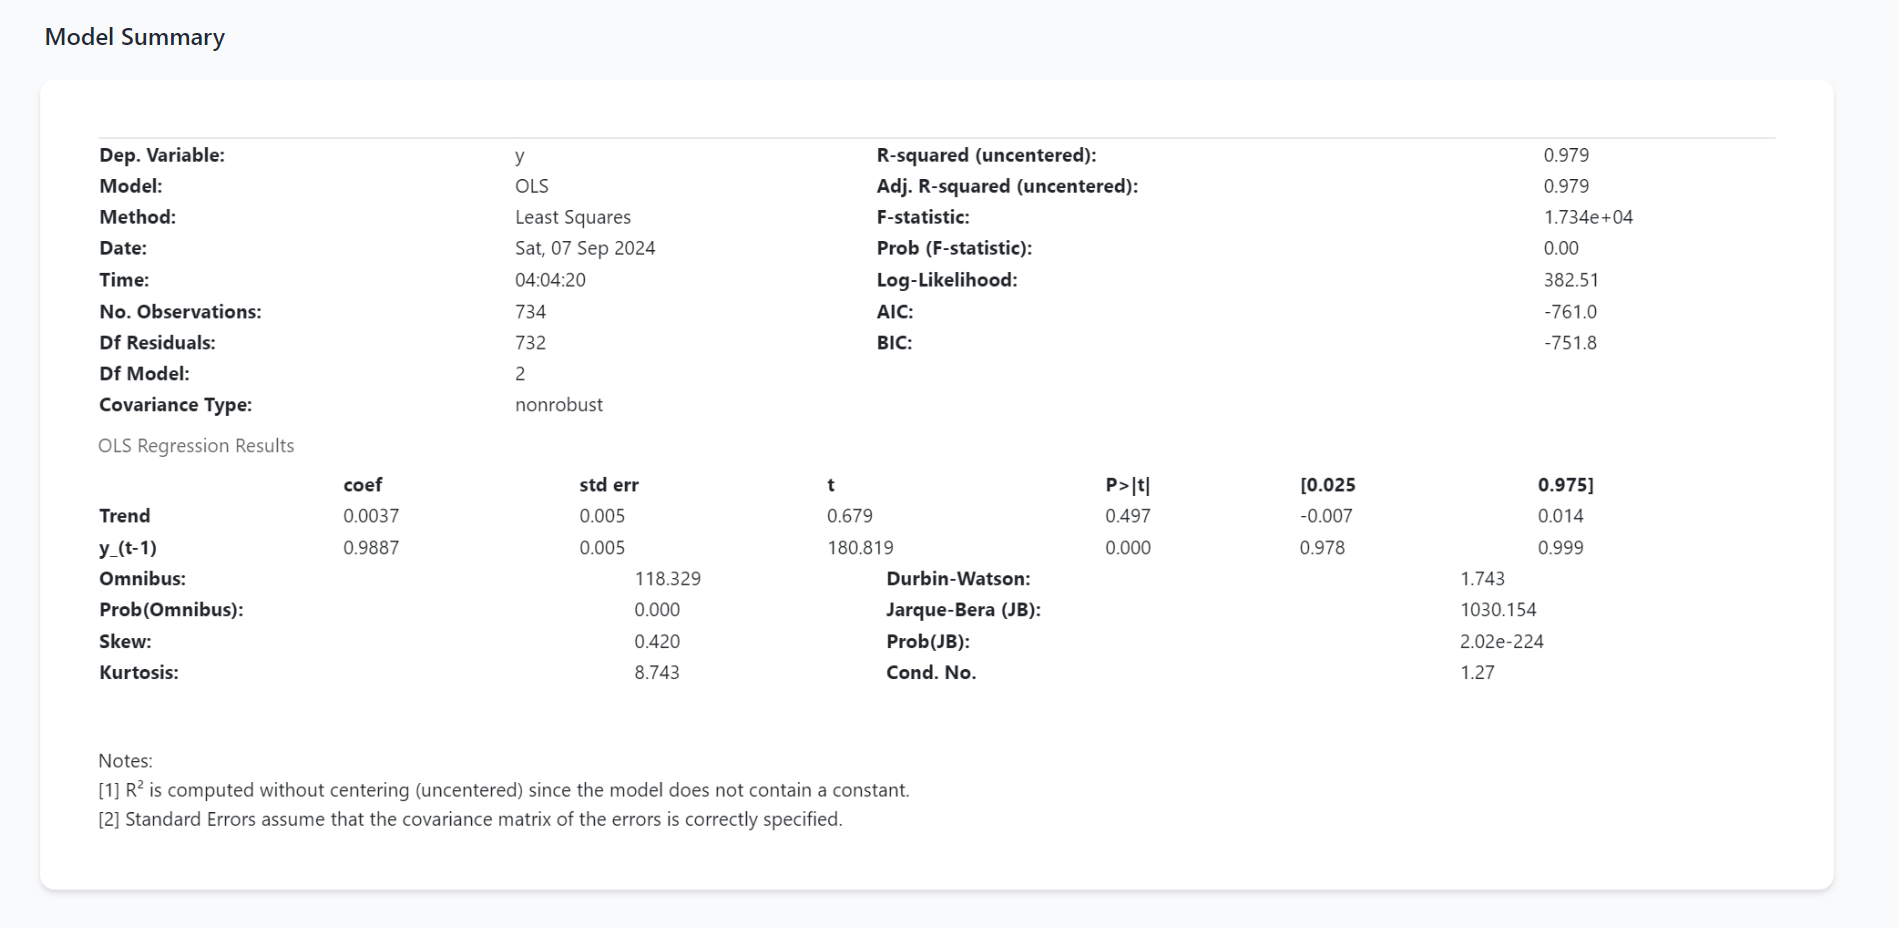
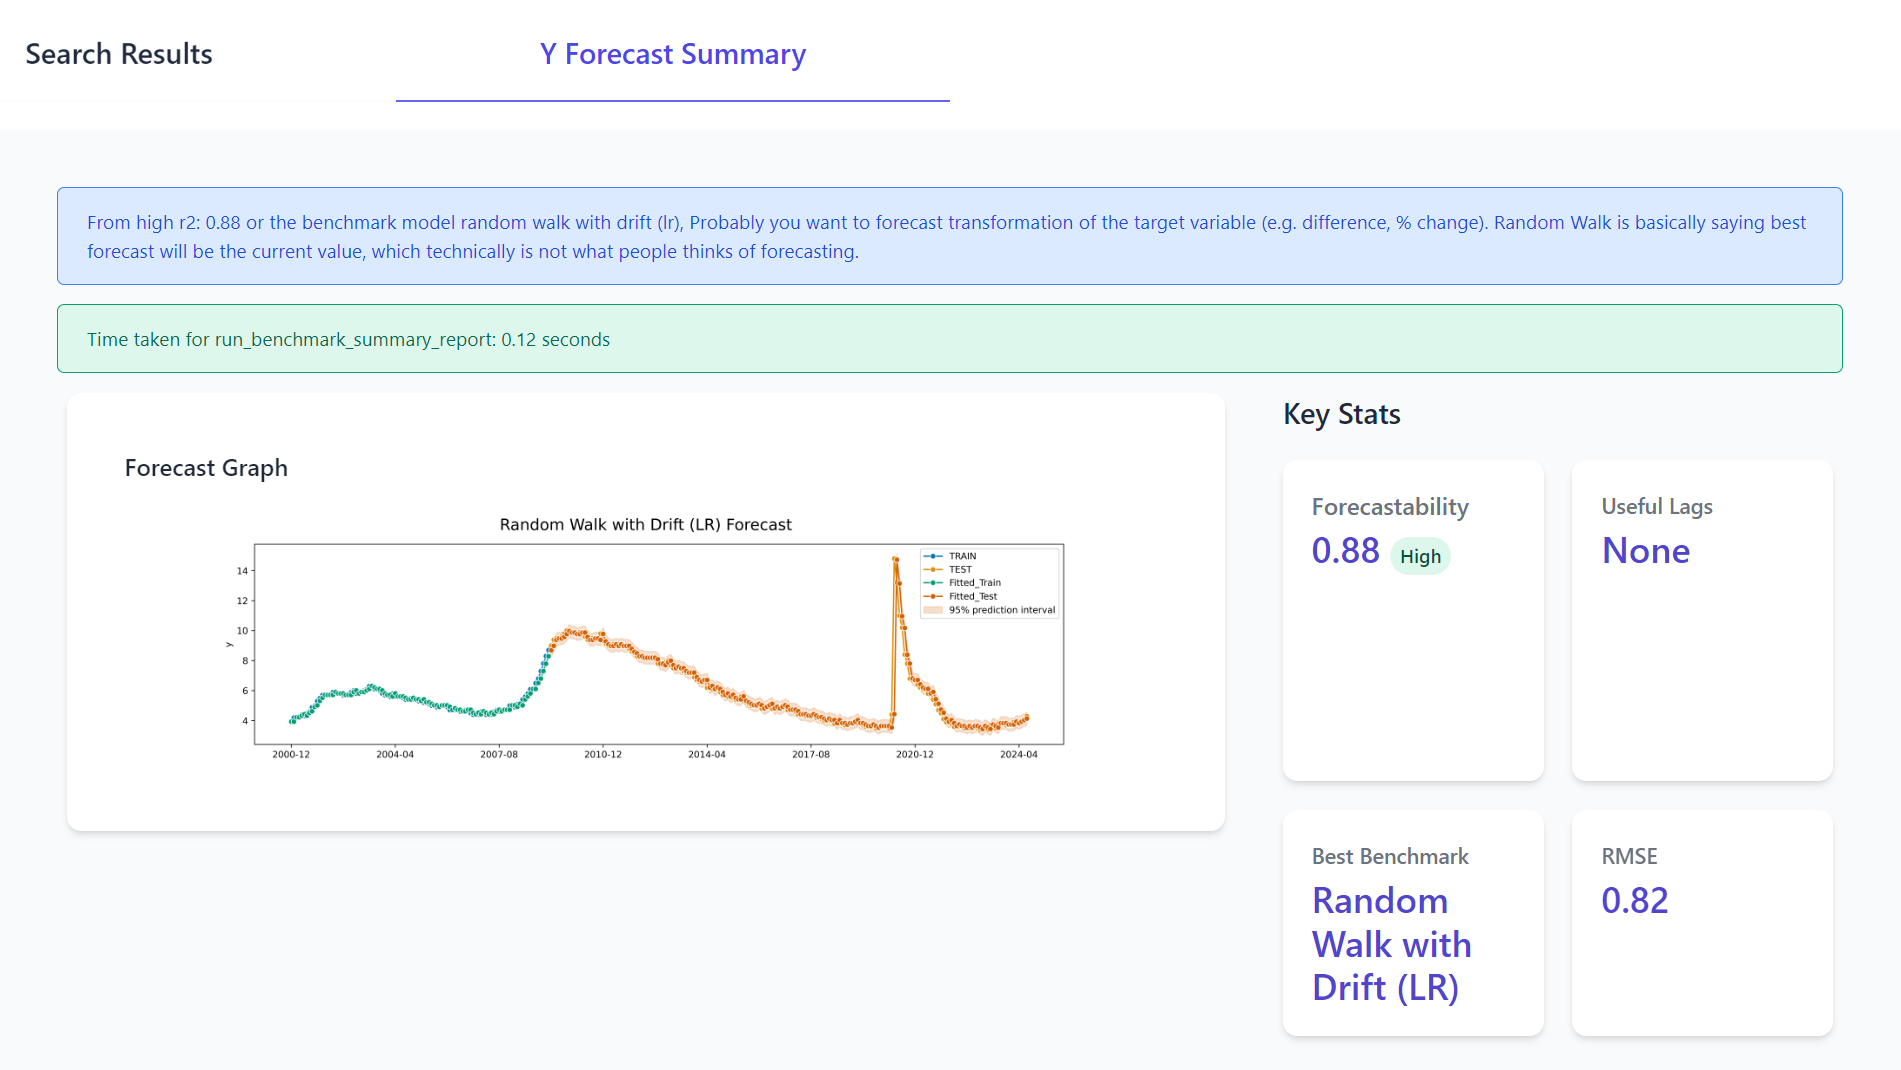 The forecast summary provides basic statistics and the univariate forecast model summary. In this example, the out-of-sample R² of 0.88 indicates high forecastability, with an average forecast error (RMSE) of 0.82.
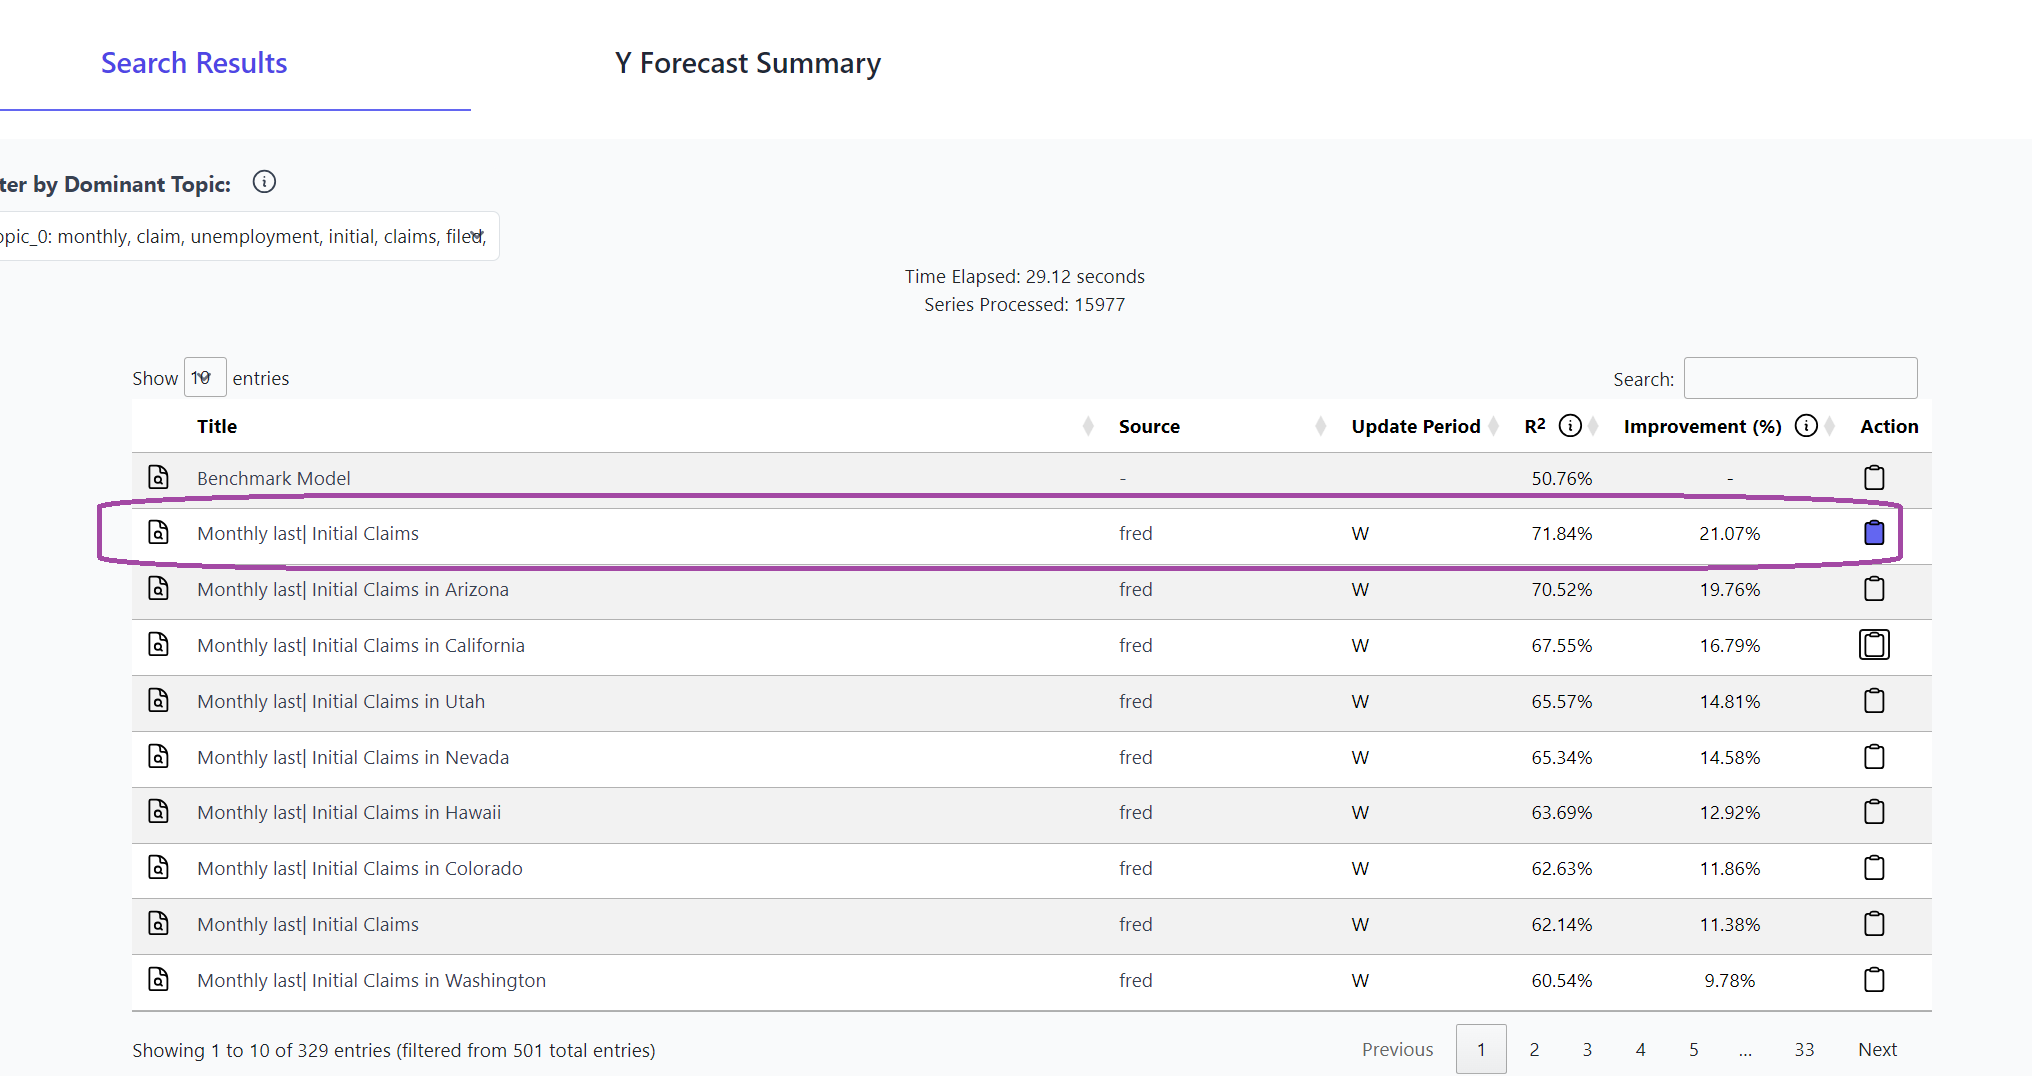
 7. Search Results:
The search results tab displays potential exogenous variables.
7. Search Results:
The search results tab displays potential exogenous variables.
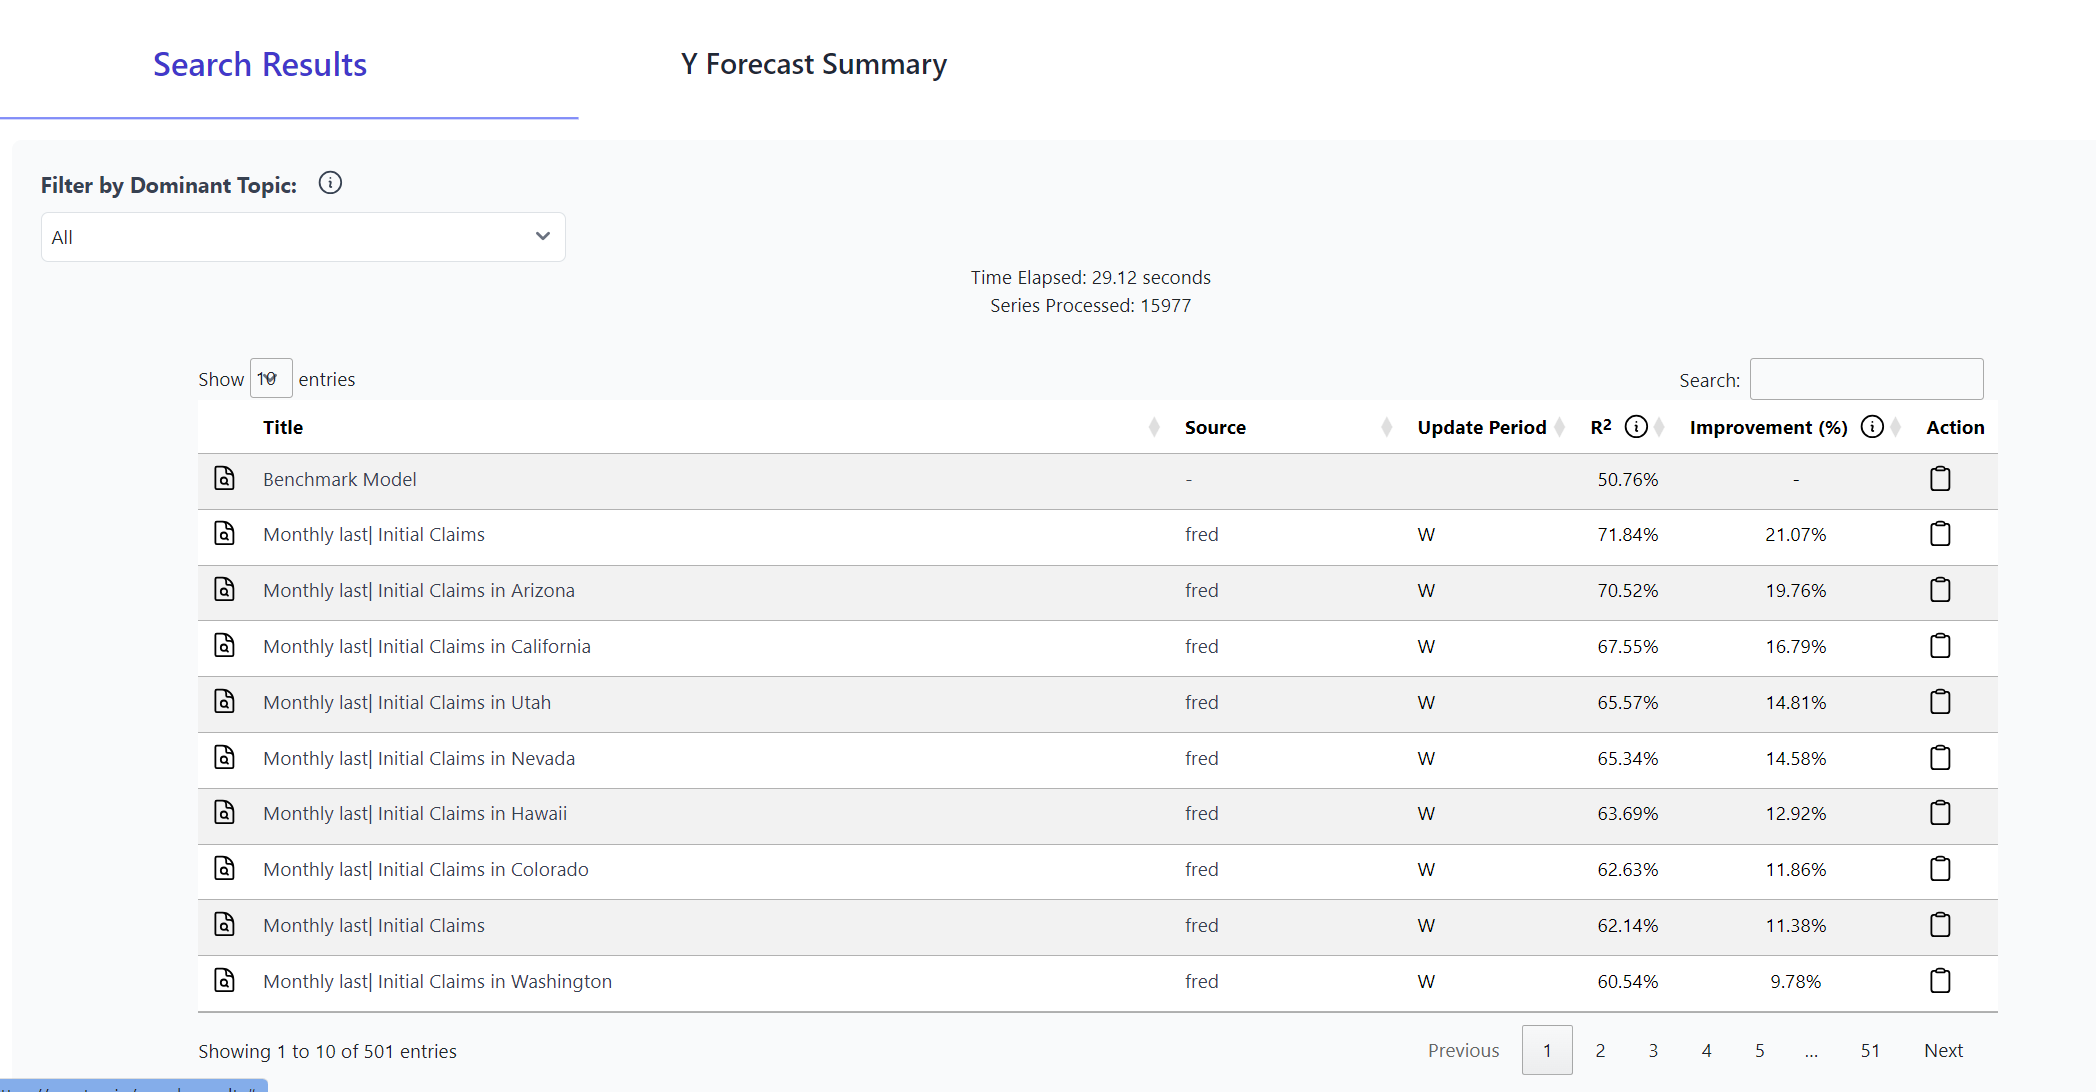 Results include data information and estimated R² improvements compared to the univariate forecast. The validation period can be viewed by clicking table rows.
8. Filtering Results:
Use the filter in the upper left corner to group variables by textual analysis.
Results include data information and estimated R² improvements compared to the univariate forecast. The validation period can be viewed by clicking table rows.
8. Filtering Results:
Use the filter in the upper left corner to group variables by textual analysis.
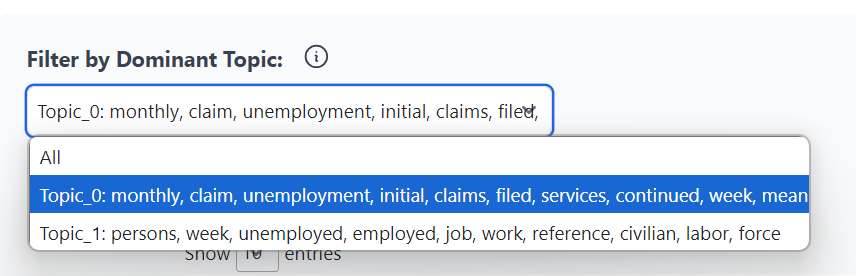 In this case, two main groups emerge: unemployment-related series and inflation-related series.
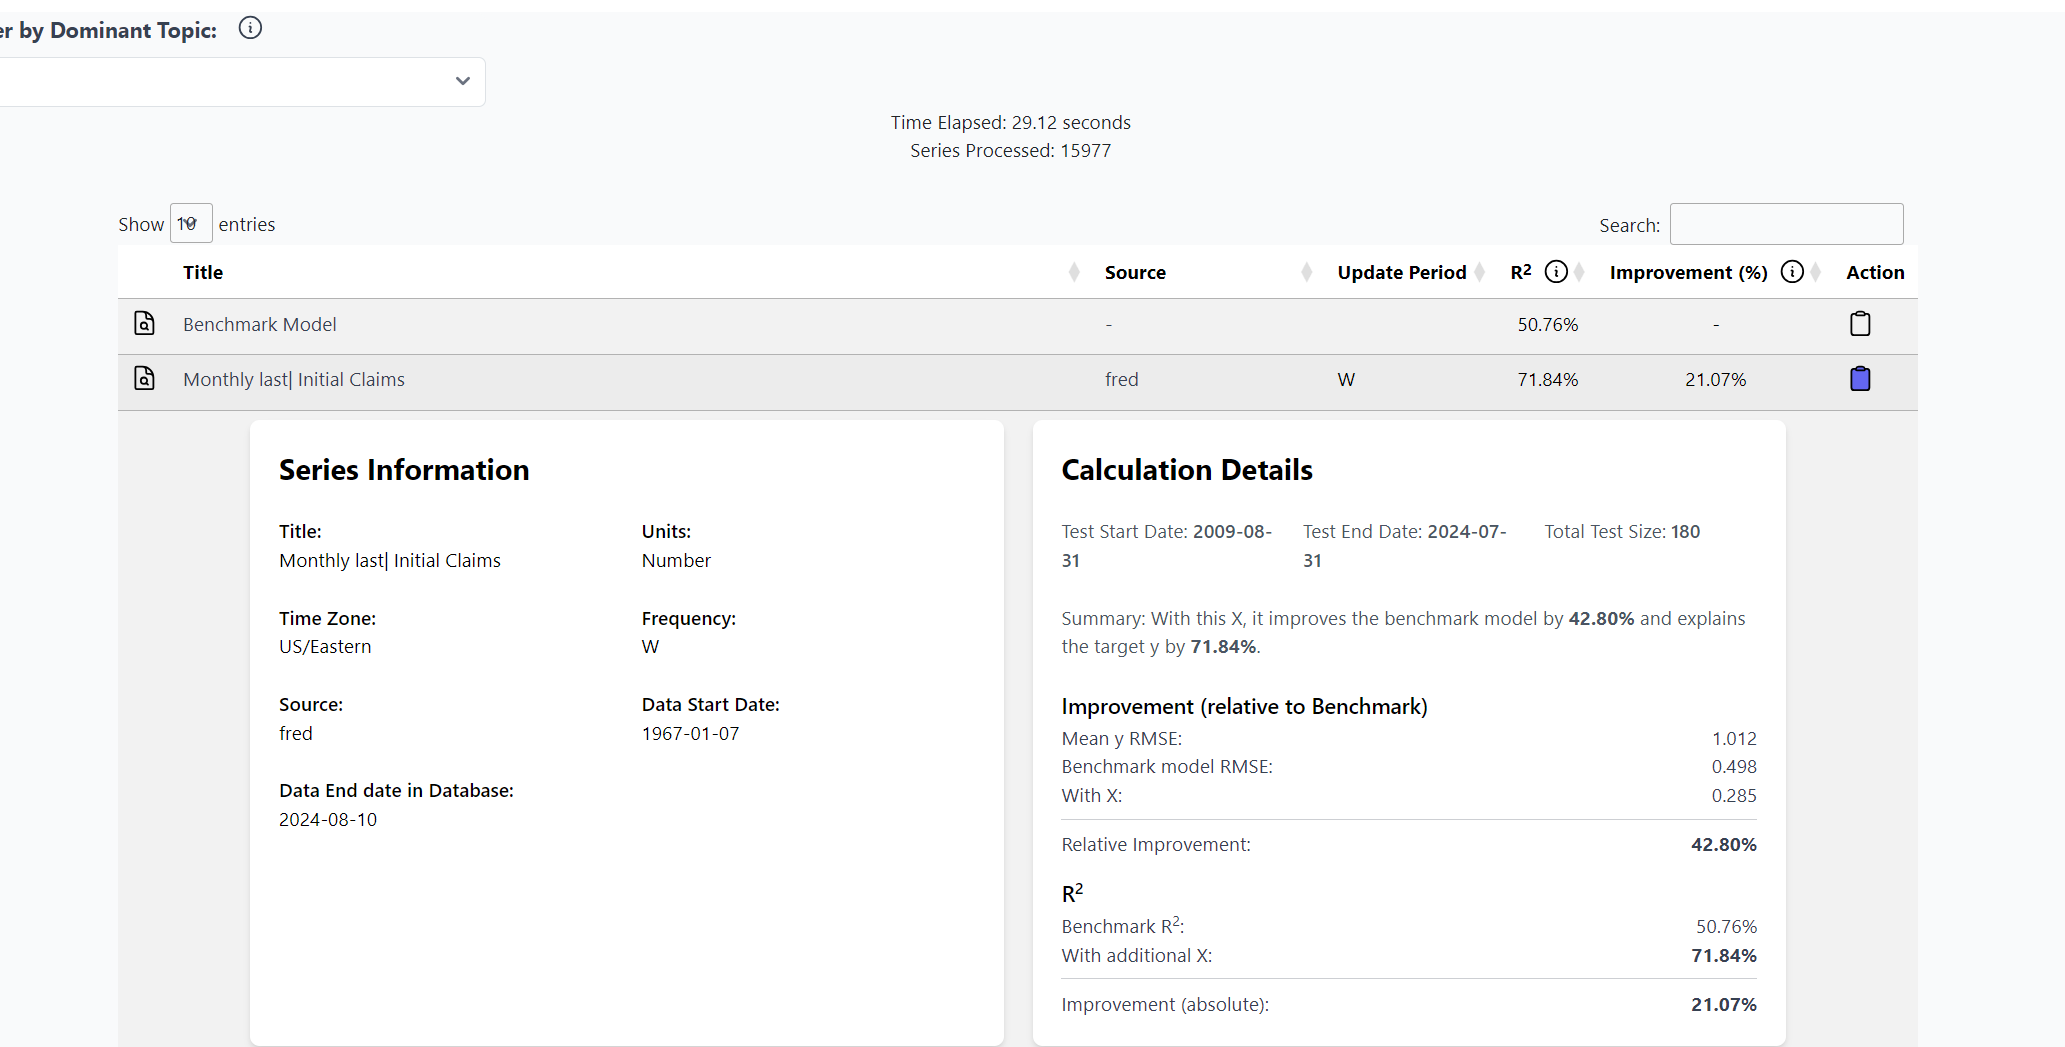
9. Detailed Information:
Click on a row to view series information and improvement estimation details. The title or source can be clicked to access the original data source.
In this case, two main groups emerge: unemployment-related series and inflation-related series.
9. Detailed Information:
Click on a row to view series information and improvement estimation details. The title or source can be clicked to access the original data source.
 10. Saving Results:
Select interesting series and use the clipboard button to save for later analysis.
10. Saving Results:
Select interesting series and use the clipboard button to save for later analysis.
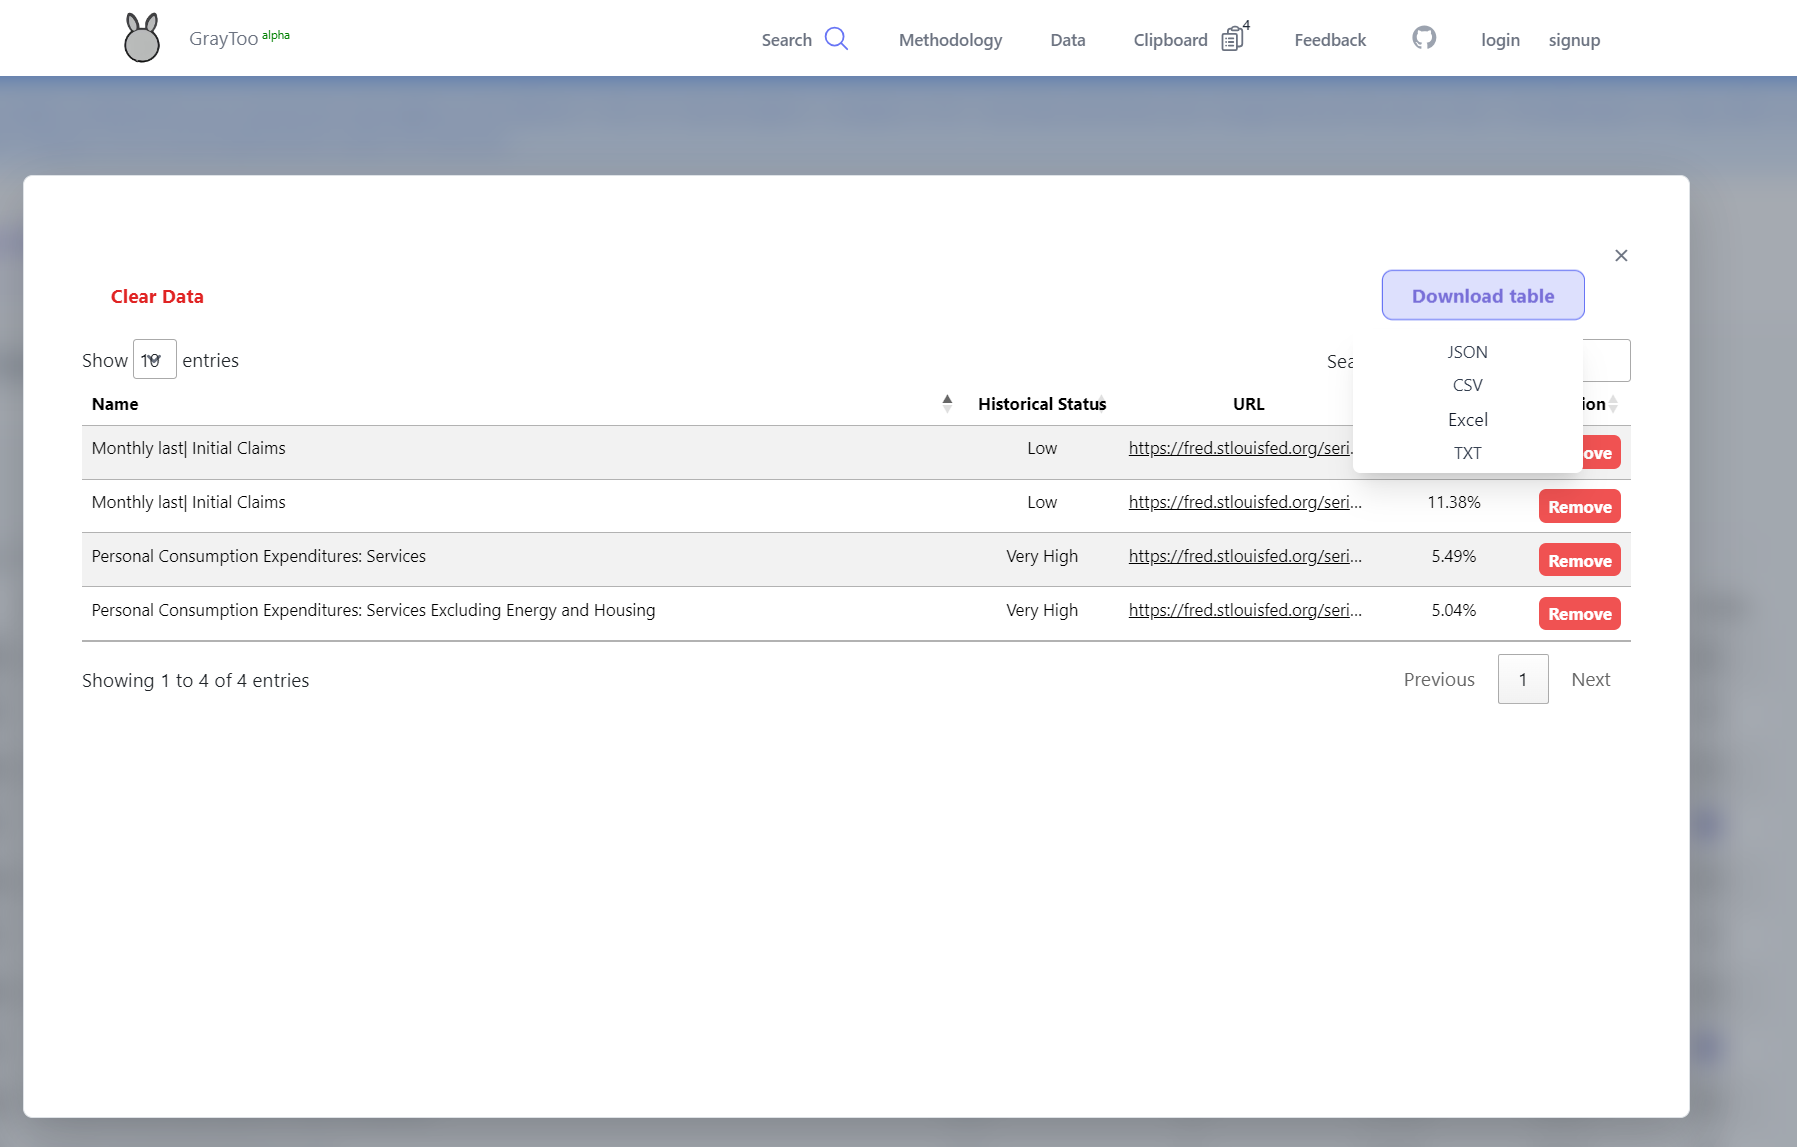
 11. Accessing Saved Results:
Click the clipboard icon at the top to download or view saved results.
11. Accessing Saved Results:
Click the clipboard icon at the top to download or view saved results.
 This concludes the guide on using the search function for forecasting. With the data sources identified, users can proceed with further analysis.
For additional use cases, please refer to the blog posts section:
Blogs - Forecast
This concludes the guide on using the search function for forecasting. With the data sources identified, users can proceed with further analysis.
For additional use cases, please refer to the blog posts section:
Blogs - Forecast