How to Use
Goal: Causality Analysis - Identifying Potential Exogenous Variables (x) Affecting the Target Variable (y)
This guide demonstrates how to use the search engine to identify potential factors affecting Real GDP values. It's important to note that this analysis focuses on correlation, not causation, and should be used as an initial screening tool.
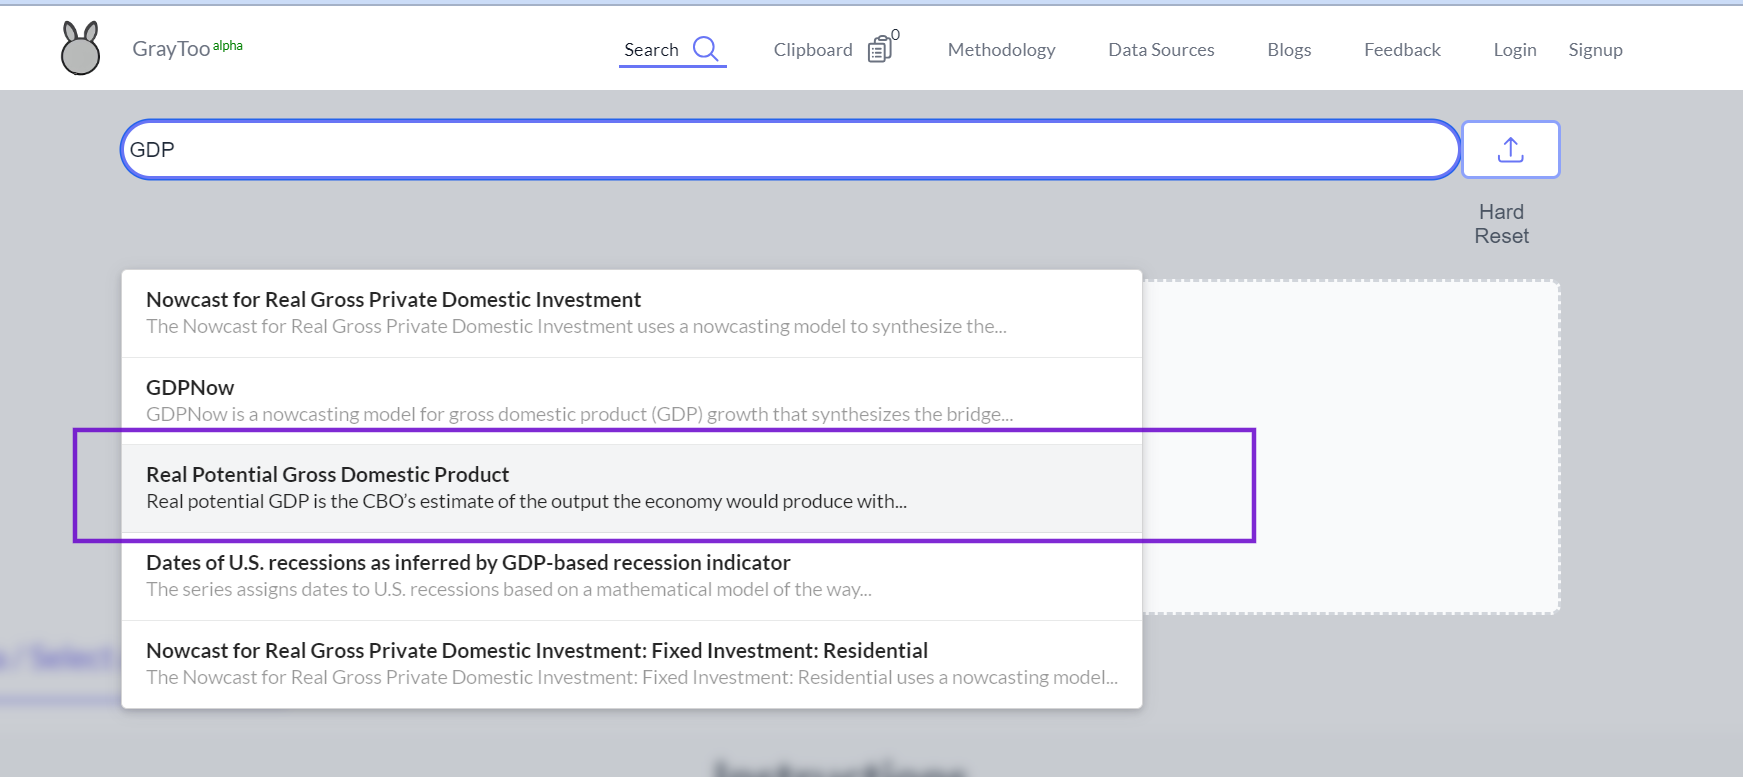
1. Data Selection:
Users can either upload their own data or utilize the existing database. In this example, we'll use Real GDP from the FRED database.
 2. Main Interface:
After data selection, three main panels are presented:
2. Main Interface:
After data selection, three main panels are presented:
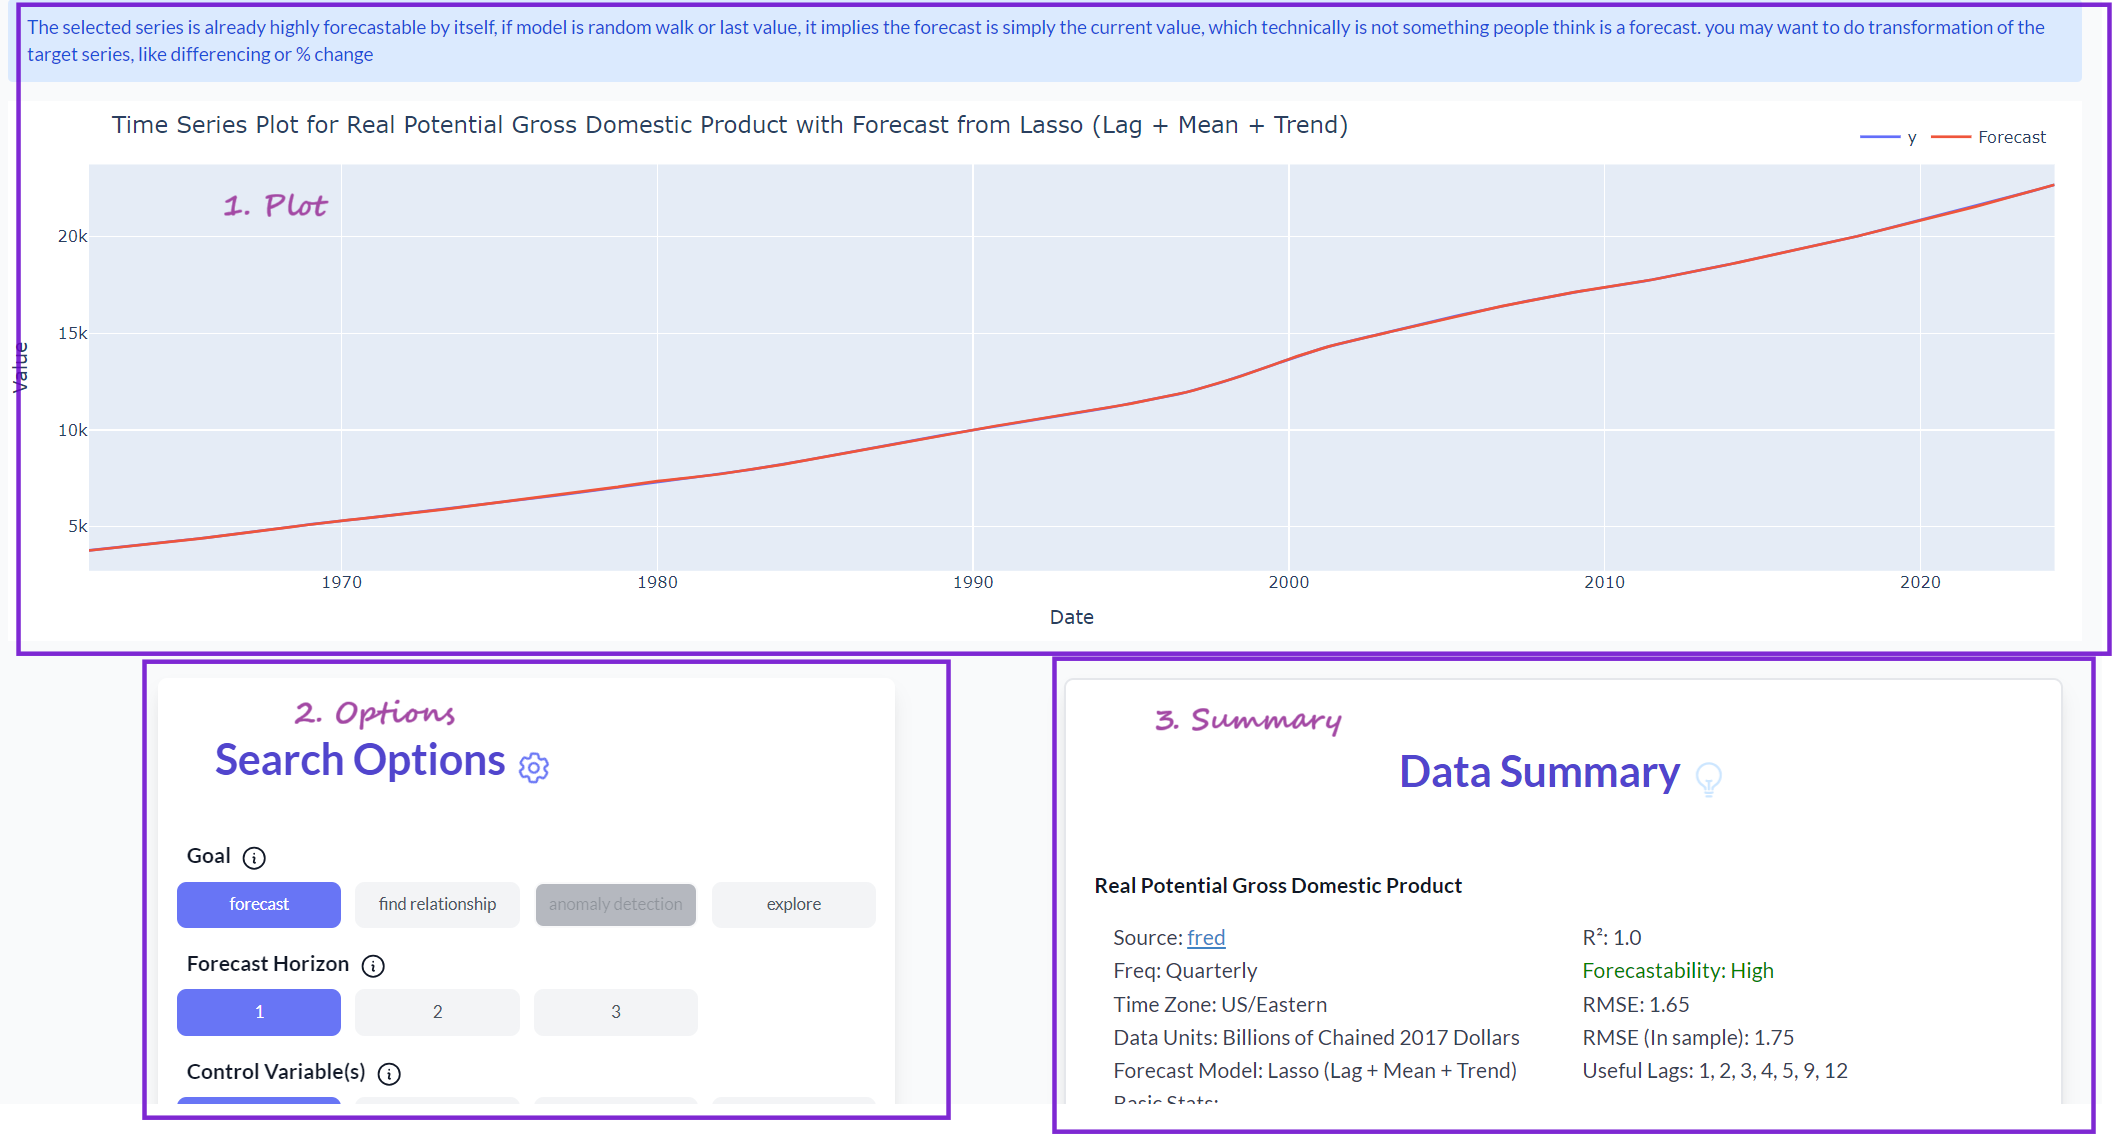 a) Time series plot of the target variable (including a rolling forecast for database entries)
b) Search options for customization
c) Summary of the selected data
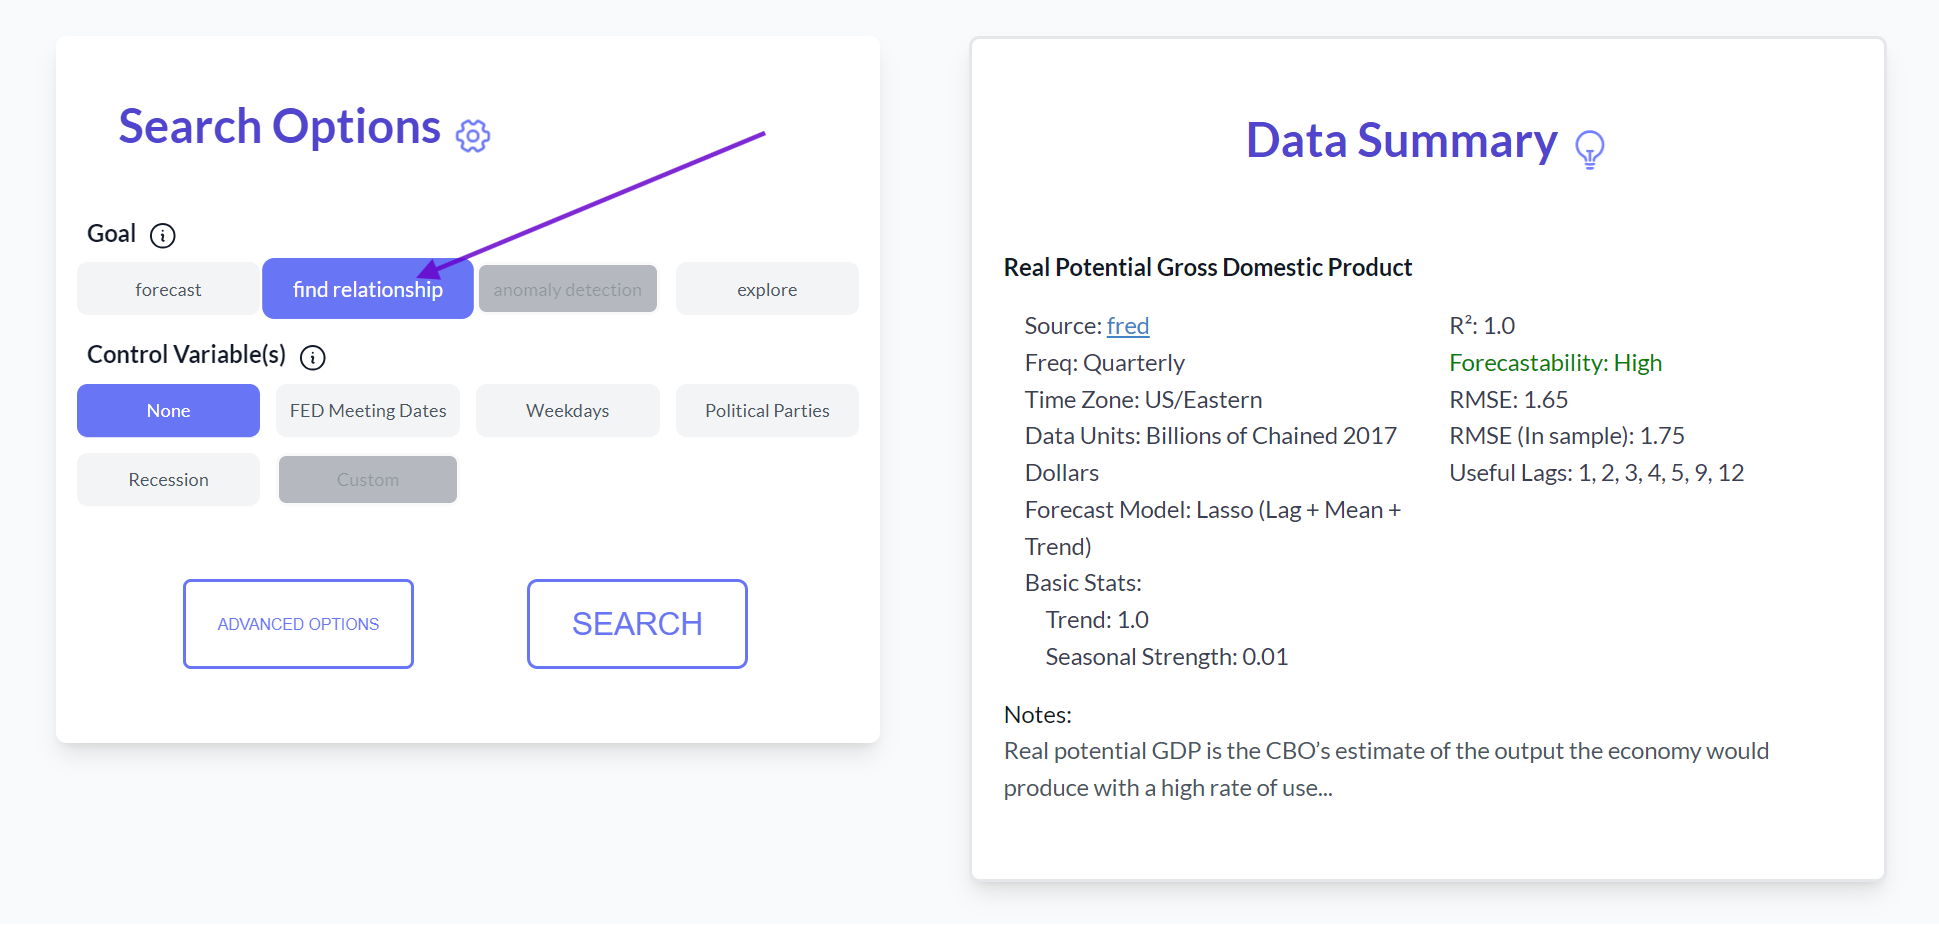
3. Search Configuration:
Set the search option to "causality analysis" for this example.
a) Time series plot of the target variable (including a rolling forecast for database entries)
b) Search options for customization
c) Summary of the selected data
3. Search Configuration:
Set the search option to "causality analysis" for this example.
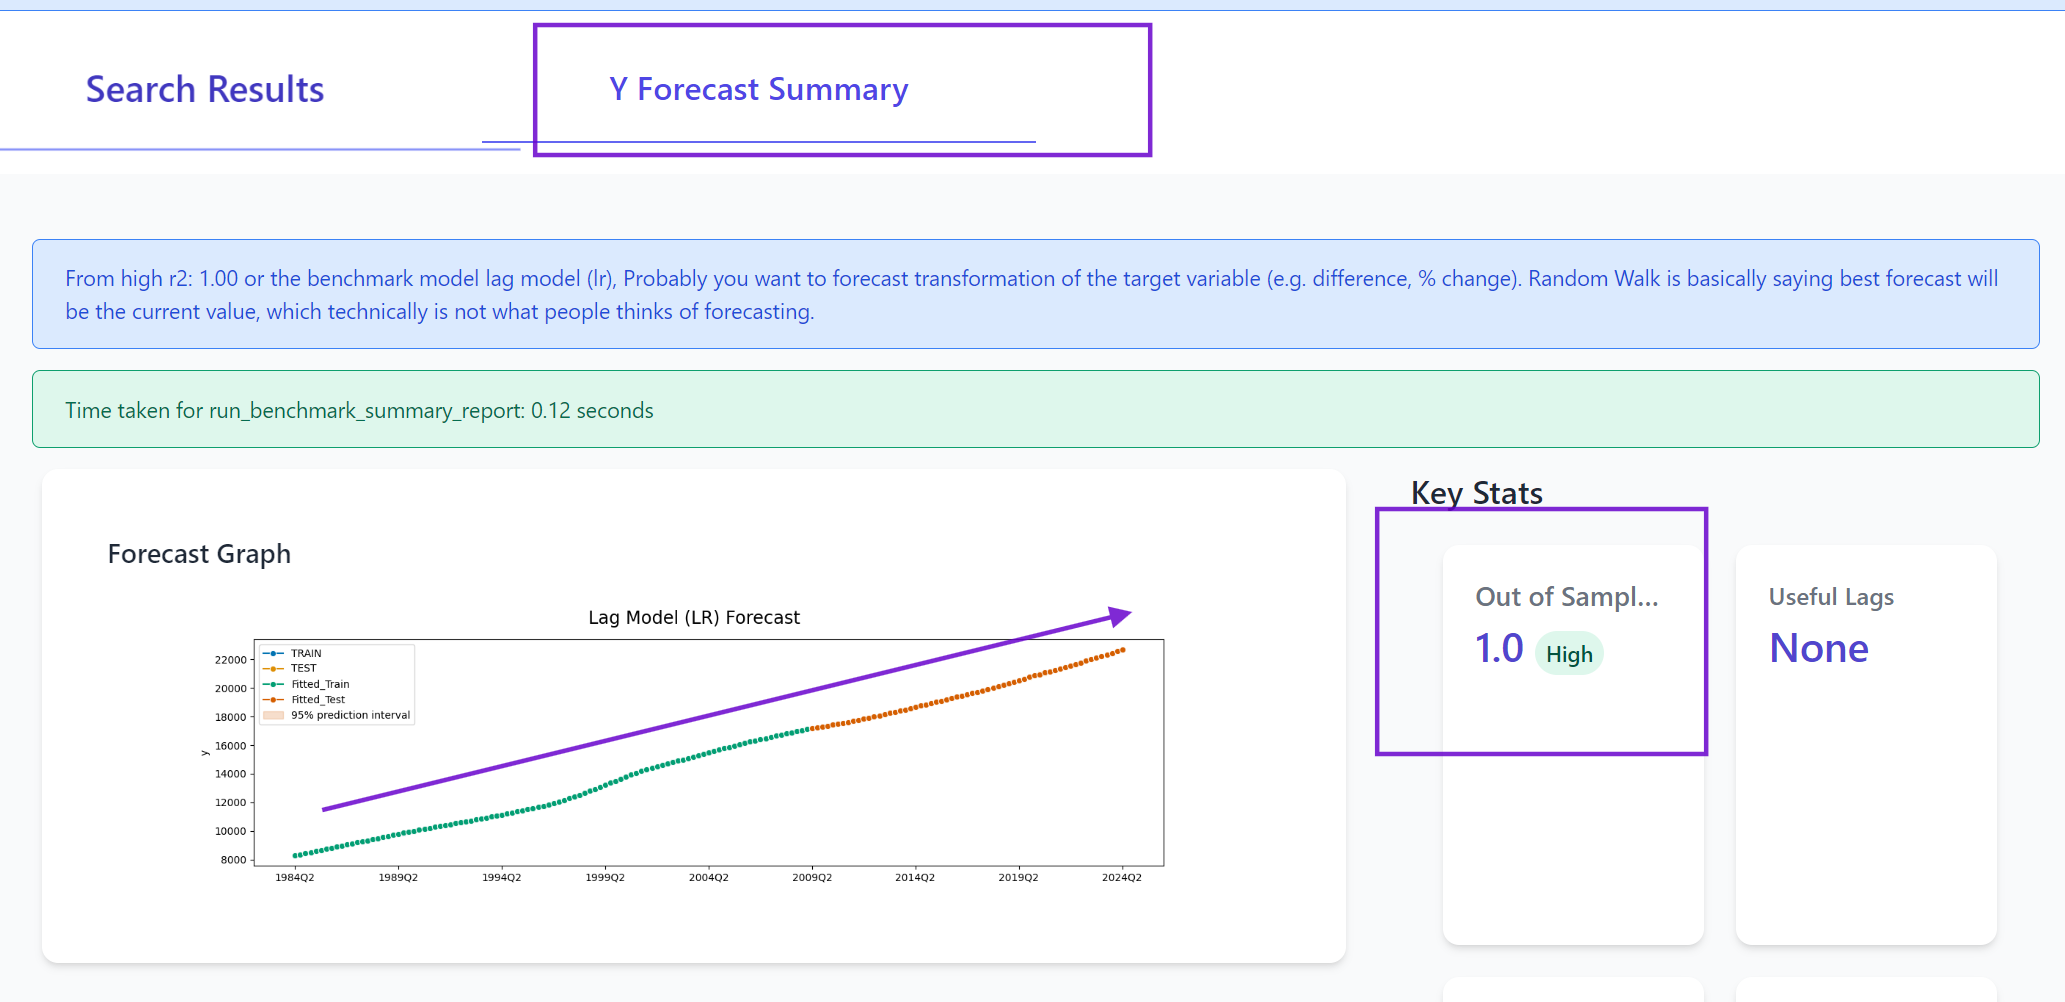
 Note: For Real GDP, where variance is largely explained by the trend (R² is 1.0), using the growth rate might be more appropriate as it removes the strong trend component.
4. Initiating the Search:
Click the search button to begin the analysis.
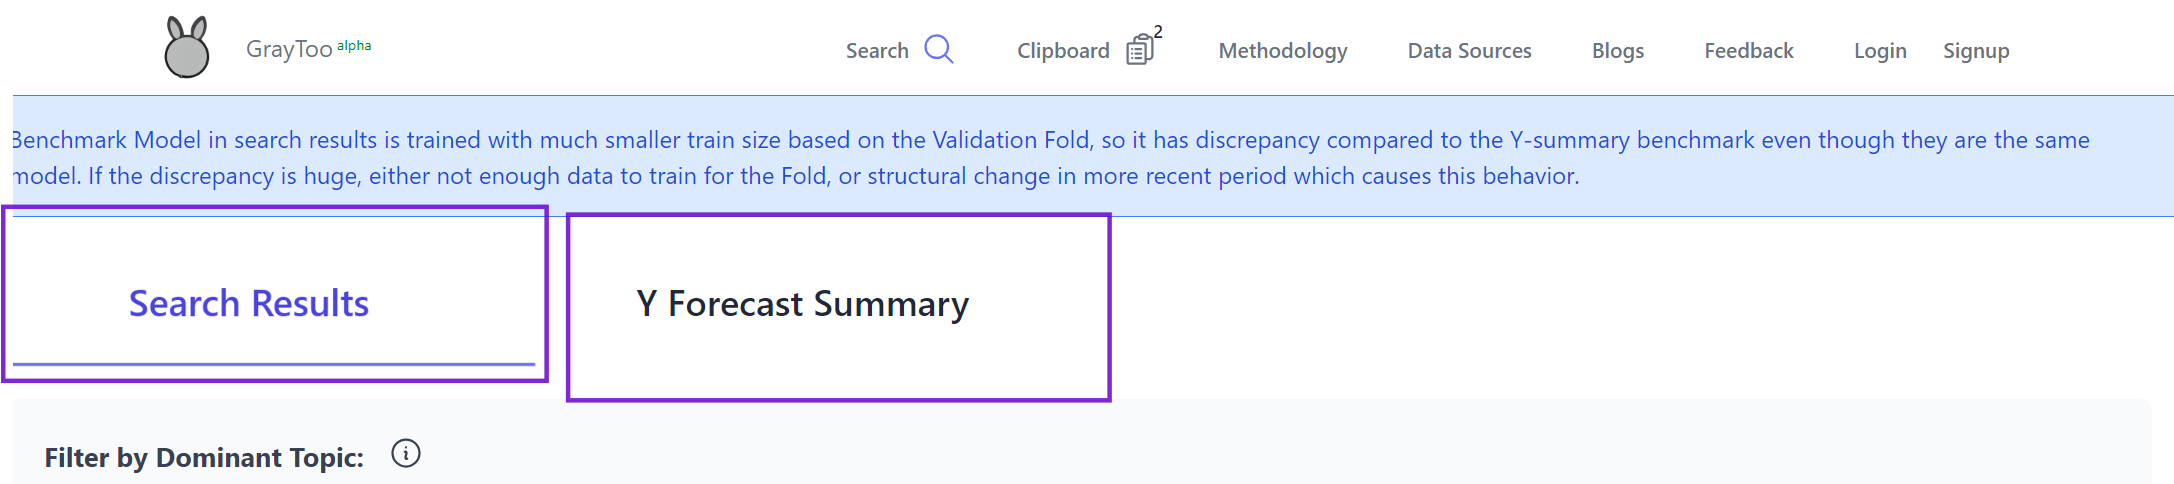
5. Results Analysis:
Two tabs are available: search results and target variable summary. Progress messages appear on the right side.
Note: For Real GDP, where variance is largely explained by the trend (R² is 1.0), using the growth rate might be more appropriate as it removes the strong trend component.
4. Initiating the Search:
Click the search button to begin the analysis.
5. Results Analysis:
Two tabs are available: search results and target variable summary. Progress messages appear on the right side.
 The target summary reveals that the benchmark model (using only the variable's own history) has a very high R² of 98%, indicating high predictability from its own past values.
 6. Search Results:
The search results tab displays potential related variables with their estimated R² improvements.
6. Search Results:
The search results tab displays potential related variables with their estimated R² improvements.
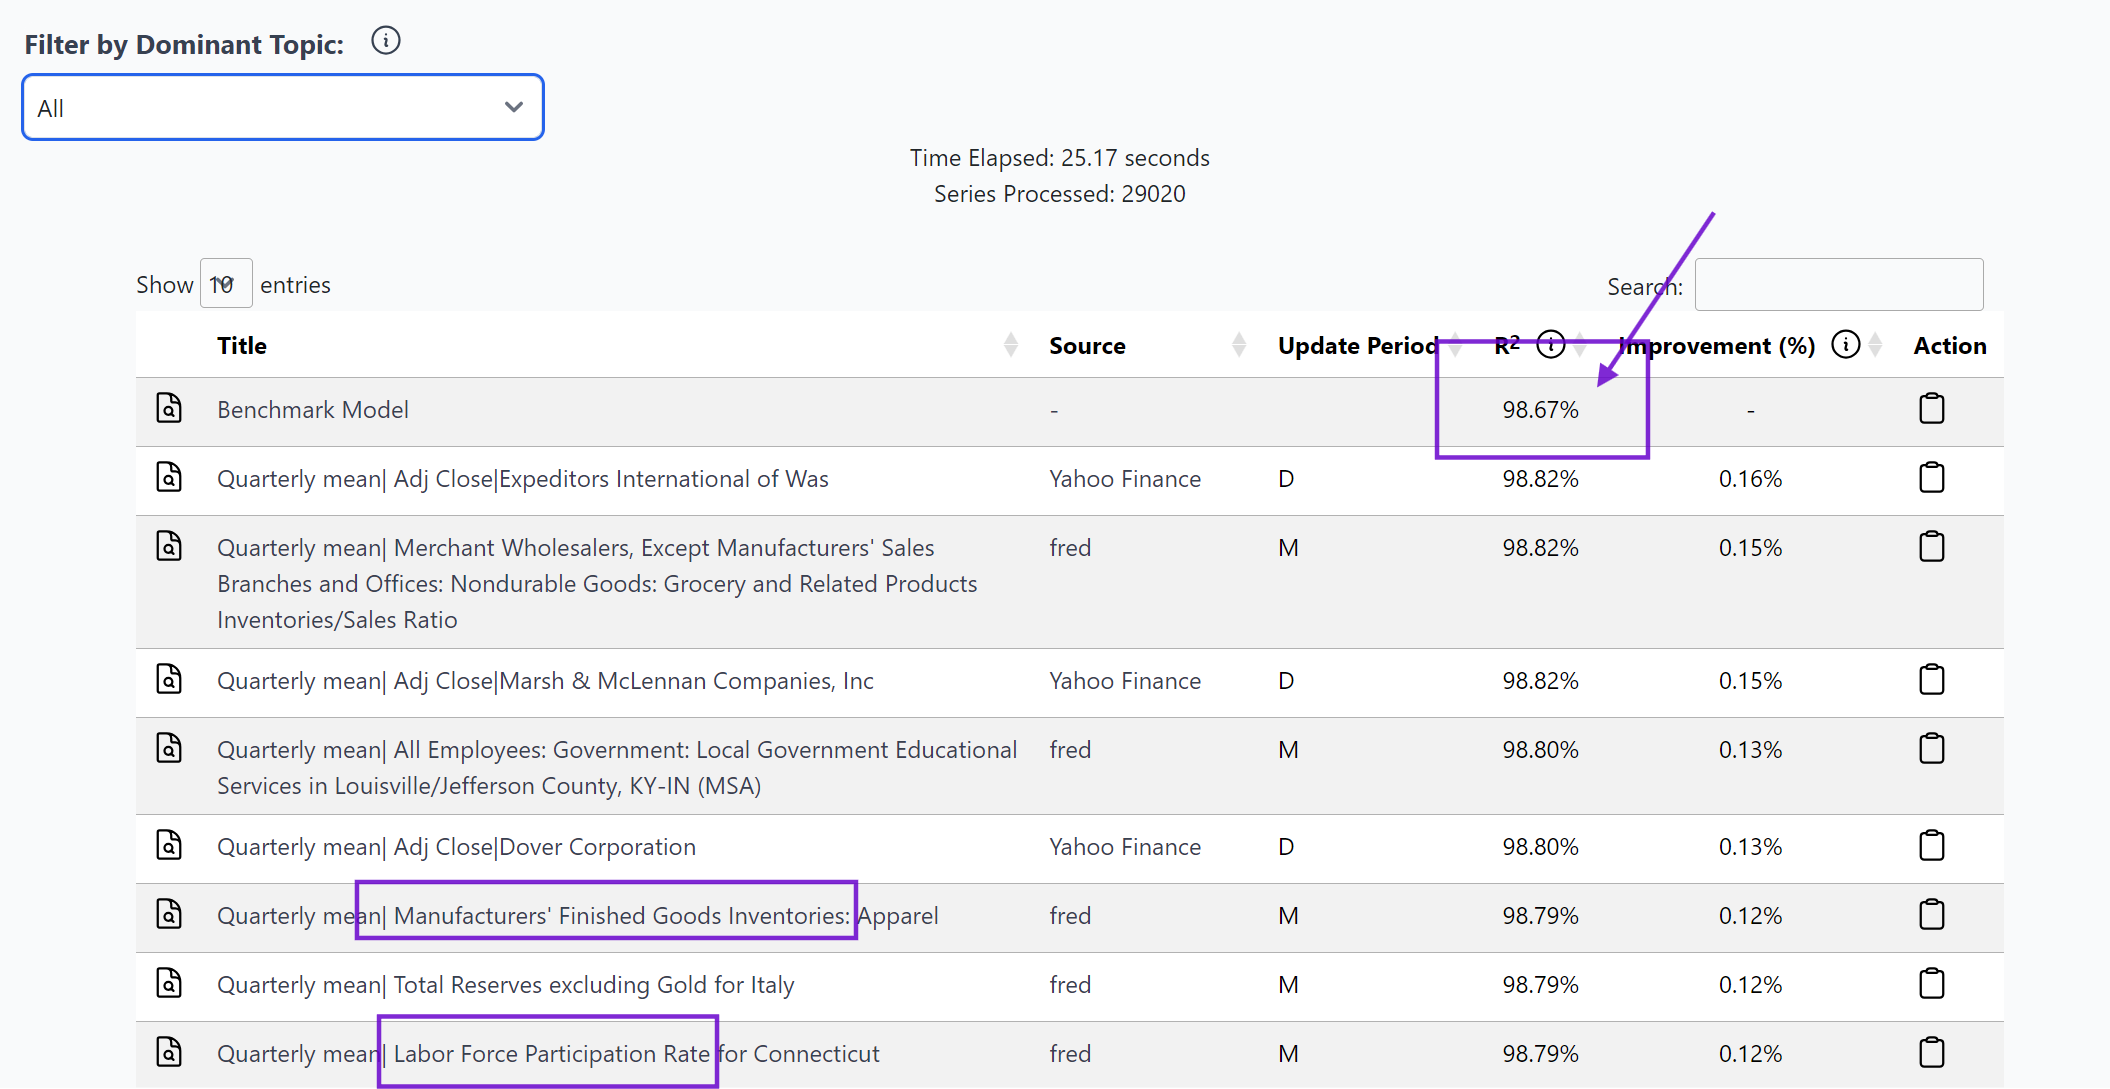 In this case, even the best additional variables only improve R² by about 0.16%, suggesting limited added predictive power beyond GDP's own history. Notable series include Labor Force Participation Rate and Manufacturer's Inventory, which could be interesting for further economic analysis despite small R² improvements.
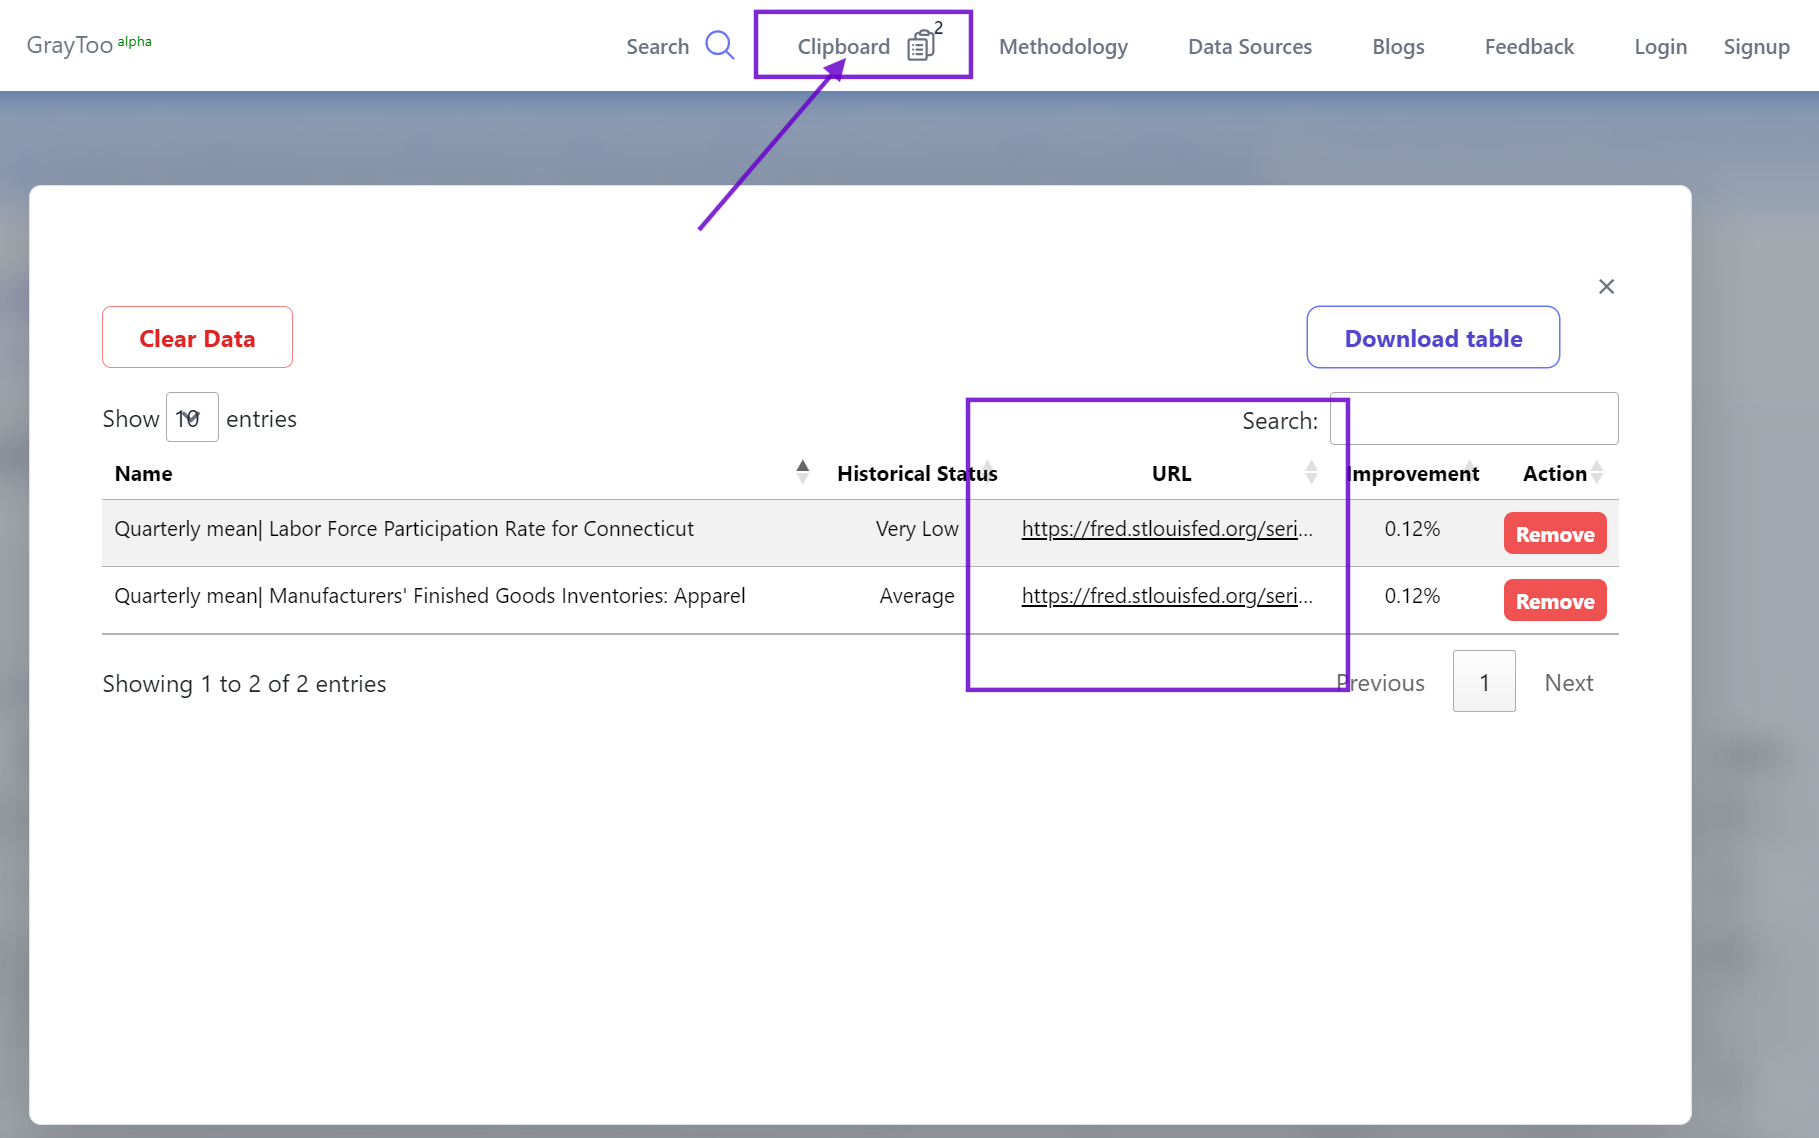
7. Saving and Analyzing Results:
To save series for later analysis:
a) Click on rows of interest in the results table.
b) Click the clipboard button next to each series to save.
c) Access the clipboard icon at the top of the page to view saved series.
d) Download selected results or view them in the clipboard.
e) Click individual rows in the clipboard view for more details, including the data source.
In this case, even the best additional variables only improve R² by about 0.16%, suggesting limited added predictive power beyond GDP's own history. Notable series include Labor Force Participation Rate and Manufacturer's Inventory, which could be interesting for further economic analysis despite small R² improvements.
7. Saving and Analyzing Results:
To save series for later analysis:
a) Click on rows of interest in the results table.
b) Click the clipboard button next to each series to save.
c) Access the clipboard icon at the top of the page to view saved series.
d) Download selected results or view them in the clipboard.
e) Click individual rows in the clipboard view for more details, including the data source.
 This process allows for the identification of potentially related variables to the target series, even when the target is highly predictable from its own history. It's important to remember that small improvements in R² can still be economically significant, especially for major economic indicators like GDP.
8. Filtering Results:
Use the dropdown in the upper left corner of the search results table to filter variables by textual analysis.
For additional use cases, please refer to the blog posts section:
Blogs - Relationship
This process allows for the identification of potentially related variables to the target series, even when the target is highly predictable from its own history. It's important to remember that small improvements in R² can still be economically significant, especially for major economic indicators like GDP.
8. Filtering Results:
Use the dropdown in the upper left corner of the search results table to filter variables by textual analysis.
For additional use cases, please refer to the blog posts section:
Blogs - Relationship